## Line Charts: Learning Performance Comparison
### Overview
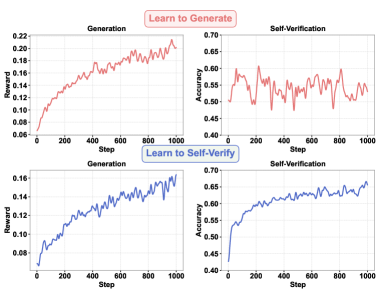
The image displays a 2x2 grid of line charts comparing two learning methods: "Learn to Generate" (top row, red lines) and "Learn to Self-Verify" (bottom row, blue lines). Each method is evaluated on two metrics: "Generation" performance (left column) and "Self-Verification" performance (right column) over 1000 training steps.
### Components/Axes
* **Layout**: A 2x2 grid. Top row charts are labeled with a red header "Learn to Generate". Bottom row charts are labeled with a blue header "Learn to Self-Verify".
* **Chart Titles**:
* Top-Left: "Generation"
* Top-Right: "Self-Verification"
* Bottom-Left: "Generation"
* Bottom-Right: "Self-Verification"
* **X-Axis (All Charts)**: Labeled "Step". Linear scale from 0 to 1000, with major tick marks at 0, 200, 400, 600, 800, 1000.
* **Y-Axis (Left Column - Generation Charts)**: Labeled "Reward". Linear scale from 0.06 to 0.22 (top-left) and 0.08 to 0.16 (bottom-left).
* **Y-Axis (Right Column - Self-Verification Charts)**: Labeled "Accuracy". Linear scale from 0.45 to 0.70 (top-right) and 0.40 to 0.70 (bottom-right).
* **Data Series**: Each chart contains a single line. The color corresponds to the learning method: red for "Learn to Generate", blue for "Learn to Self-Verify".
### Detailed Analysis
**1. Top-Left Chart: "Learn to Generate" - Generation (Reward vs. Step)**
* **Trend**: The red line shows a clear, noisy upward trend. It starts low, increases rapidly until around step 400, then continues to rise with significant volatility.
* **Key Data Points (Approximate)**:
* Step 0: ~0.06
* Step 200: ~0.14
* Step 400: ~0.18
* Step 600: ~0.19
* Step 800: ~0.20
* Step 1000: ~0.22
* **Characteristics**: High variance/noise throughout the training process.
**2. Top-Right Chart: "Learn to Generate" - Self-Verification (Accuracy vs. Step)**
* **Trend**: The red line fluctuates heavily with no strong, consistent upward or downward trend. It oscillates within a band.
* **Key Data Points (Approximate)**:
* The line mostly stays between 0.50 and 0.60 accuracy.
* It shows sharp peaks and troughs (e.g., a peak near 0.60 at ~step 100, a trough near 0.48 at ~step 300).
* Ends near 0.55 at step 1000.
* **Characteristics**: Highly unstable performance, suggesting the self-verification capability does not reliably improve with generation training under this method.
**3. Bottom-Left Chart: "Learn to Self-Verify" - Generation (Reward vs. Step)**
* **Trend**: The blue line shows a steady, less noisy upward trend compared to its red counterpart. The growth is more consistent.
* **Key Data Points (Approximate)**:
* Step 0: ~0.08
* Step 200: ~0.11
* Step 400: ~0.13
* Step 600: ~0.14
* Step 800: ~0.15
* Step 1000: ~0.16
* **Characteristics**: Smoother learning curve with lower variance.
**4. Bottom-Right Chart: "Learn to Self-Verify" - Self-Verification (Accuracy vs. Step)**
* **Trend**: The blue line shows a strong, consistent upward trend with moderate noise. It demonstrates clear improvement over time.
* **Key Data Points (Approximate)**:
* Step 0: ~0.45
* Step 200: ~0.55
* Step 400: ~0.58
* Step 600: ~0.62
* Step 800: ~0.64
* Step 1000: ~0.65
* **Characteristics**: Stable and improving self-verification accuracy.
### Key Observations
1. **Method Contrast**: The "Learn to Self-Verify" method (blue) produces smoother, more stable learning curves for both generation reward and verification accuracy compared to the "Learn to Generate" method (red).
2. **Verification Stability**: The most striking difference is in the Self-Verification charts. The red line (Learn to Generate) is chaotic and stagnant, while the blue line (Learn to Self-Verify) shows reliable improvement.
3. **Reward vs. Accuracy Correlation**: For the "Learn to Self-Verify" method, the upward trends in both Generation Reward and Self-Verification Accuracy are correlated, suggesting the two capabilities improve together.
4. **Final Performance**: At step 1000, "Learn to Generate" achieves a higher final reward (~0.22 vs ~0.16) but a lower and more unstable verification accuracy (~0.55 vs ~0.65).
### Interpretation
The data suggests a fundamental trade-off or difference in learning dynamics between the two approaches.
* The **"Learn to Generate"** method appears to optimize aggressively for the primary reward signal (generation), achieving higher final reward values. However, this comes at the cost of a unstable and non-improving secondary capability (self-verification). This could indicate overfitting to the reward signal or a failure to learn a robust internal verification model. The high noise suggests the learning process is volatile.
* The **"Learn to Self-Verify"** method demonstrates more holistic and stable learning. While its final generation reward is lower, both its generation and verification capabilities improve steadily and in tandem. This implies the method fosters a more integrated learning process where the ability to verify outputs supports and stabilizes the ability to generate them. The lower noise indicates a more reliable training progression.
**In essence, the charts illustrate that directly optimizing for generation reward ("Learn to Generate") may yield higher peak performance on that metric but can destabilize other aspects of the system. In contrast, a method that explicitly incorporates self-verification ("Learn to Self-Verify") promotes balanced, stable, and correlated improvement across multiple competencies, which may be preferable for building reliable and robust AI systems.** The choice between methods would depend on whether the priority is maximizing a single metric or achieving stable, multi-faceted competence.