## Line Graphs: Comparative Analysis of "Learn to Generate" and "Learn to Self-Verify" Phases
### Overview
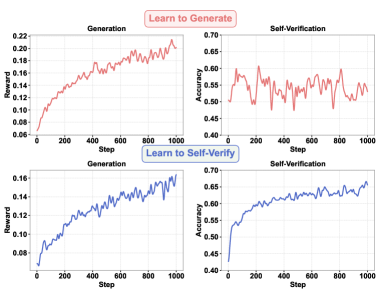
The image contains four line graphs arranged in a 2x2 grid, comparing two learning phases ("Learn to Generate" and "Learn to Self-Verify") across two metrics: **Reward** (y-axis: 0.06–0.22) and **Accuracy** (y-axis: 0.40–0.70). The x-axis represents **Steps** (0–1000). Red lines correspond to the "Learn to Generate" phase, while blue lines represent the "Learn to Self-Verify" phase.
### Components/Axes
- **X-axis**: "Step" (0–1000), incrementing by 200.
- **Y-axes**:
- Top-left/bottom-left: "Reward" (0.06–0.22).
- Top-right/bottom-right: "Accuracy" (0.40–0.70).
- **Legends**:
- Red lines: "Learn to Generate" (top row).
- Blue lines: "Learn to Self-Verify" (bottom row).
### Detailed Analysis
1. **Top-left ("Learn to Generate" - Reward)**:
- Red line starts at ~0.06 (Step 0) and rises steadily to ~0.22 (Step 1000), with minor fluctuations (e.g., ~0.18 at Step 400).
- Trend: Consistent upward trajectory with slight volatility.
2. **Top-right ("Learn to Generate" - Accuracy)**:
- Red line fluctuates between ~0.45 and ~0.65, peaking near Step 200 (~0.60) and dipping to ~0.45 at Step 600.
- Trend: Highly volatile, with no clear directional bias.
3. **Bottom-left ("Learn to Self-Verify" - Reward)**:
- Blue line starts at ~0.08 (Step 0) and increases smoothly to ~0.16 (Step 1000), with minor oscillations (e.g., ~0.14 at Step 600).
- Trend: Steady upward progression, less volatile than the red line.
4. **Bottom-right ("Learn to Self-Verify" - Accuracy)**:
- Blue line rises from ~0.40 (Step 0) to ~0.65 (Step 1000), with minor fluctuations (e.g., ~0.55 at Step 400).
- Trend: Gradual, stable improvement.
### Key Observations
- **Phase Comparison**:
- The "Learn to Self-Verify" phase (blue lines) consistently outperforms the "Learn to Generate" phase (red lines) in both **Reward** and **Accuracy**.
- Self-Verification accuracy stabilizes at ~0.65 in the later phase, compared to ~0.60 in the earlier phase.
- **Volatility**:
- Self-Verification accuracy in the "Learn to Generate" phase shows significant instability (~0.45–0.65), suggesting challenges in error detection.
- **Reward Growth**:
- Both phases improve reward over time, but the "Learn to Self-Verify" phase achieves higher values (~0.16 vs. ~0.22 for Generate).
### Interpretation
The data suggests that **self-verification enhances both performance and stability**. The "Learn to Generate" phase demonstrates initial progress but struggles with consistency, likely due to immature error-checking mechanisms. In contrast, the "Learn to Self-Verify" phase shows refined capabilities, with smoother reward growth and higher, more reliable accuracy. This implies that self-verification acts as a stabilizing force, reducing errors and improving output quality over time. The divergence in trends highlights the importance of iterative feedback loops in optimizing generative models.