## Diagram: Multimodal Fusion with U-Fair Loss
### Overview
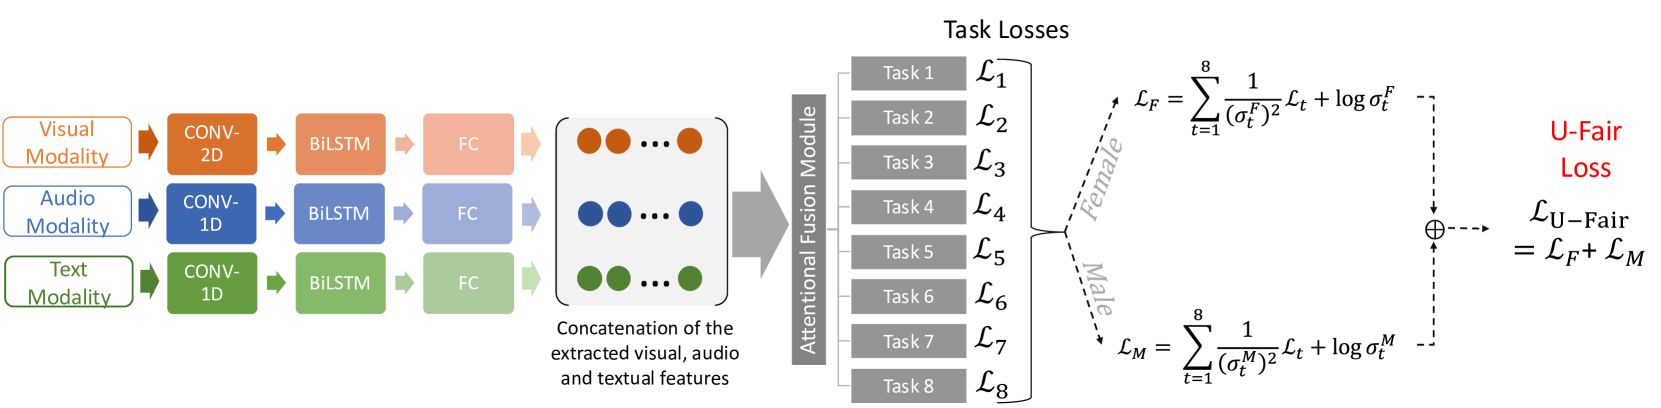
This diagram illustrates a multimodal fusion architecture incorporating visual, audio, and text modalities, processed through convolutional and recurrent neural networks, and culminating in a U-Fair loss function designed to address potential gender bias. The diagram depicts the flow of data through the system, from input modalities to task losses, and finally to the overall U-Fair loss.
### Components/Axes
The diagram is segmented into three main regions: Input Modalities & Feature Extraction (left), Attentional Fusion Module (center), and Task Losses & U-Fair Loss (right).
* **Input Modalities:** Visual Modality, Audio Modality, Text Modality.
* **Processing Blocks:** CONV-2D, CONV-1D, BiLSTM, FC (Fully Connected).
* **Attentional Fusion Module:** A gray rectangular block labeled "Attentional Fusion Module".
* **Task Losses:** L1 to L8, representing losses for eight different tasks.
* **U-Fair Loss:** Represented as L<sub>U-Fair</sub>, calculated as the sum of L<sub>F</sub> (Female Loss) and L<sub>M</sub> (Male Loss).
* **Loss Equations:** Two equations are provided, one for L<sub>F</sub> and one for L<sub>M</sub>.
### Detailed Analysis or Content Details
**Left Side: Input Modalities & Feature Extraction**
* **Visual Modality:** Input is processed through a CONV-2D layer, followed by a BiLSTM layer, and then a FC layer. The output is represented by a series of red dots.
* **Audio Modality:** Input is processed through a CONV-1D layer, followed by a BiLSTM layer, and then a FC layer. The output is represented by a series of blue dots.
* **Text Modality:** Input is processed through a CONV-1D layer, followed by a BiLSTM layer, and then a FC layer. The output is represented by a series of green dots.
* **Concatenation:** The outputs from all three modalities are concatenated, labeled "Concatenation of the extracted visual, audio and textual features".
**Center: Attentional Fusion Module**
* The concatenated features are fed into an "Attentional Fusion Module" (gray rectangle).
**Right Side: Task Losses & U-Fair Loss**
* **Task Losses:** Eight task losses are listed: L1, L2, L3, L4, L5, L6, L7, L8.
* **Female Loss (L<sub>F</sub>):** The equation for L<sub>F</sub> is: L<sub>F</sub> = Σ<sub>t=1</sub><sup>8</sup> [1/ (σ<sub>f</sub><sup>2</sup>) + log(σ<sub>f</sub><sup>2</sup>)]
* **Male Loss (L<sub>M</sub>):** The equation for L<sub>M</sub> is: L<sub>M</sub> = Σ<sub>t=1</sub><sup>8</sup> [1/ (σ<sub>M</sub><sup>2</sup>) + log(σ<sub>M</sub><sup>2</sup>)]
* **U-Fair Loss (L<sub>U-Fair</sub>):** The equation for L<sub>U-Fair</sub> is: L<sub>U-Fair</sub> = L<sub>F</sub> + L<sub>M</sub>.
* The female and male losses are summed using a circular summation symbol (⊕) to produce the U-Fair Loss.
### Key Observations
* The architecture employs a common pattern of Convolutional layers for initial feature extraction, followed by BiLSTM layers for sequential modeling, and finally Fully Connected layers for classification or regression.
* The U-Fair loss function explicitly addresses potential gender bias by calculating separate losses for female and male predictions and then combining them.
* The use of the summation symbol (⊕) suggests an additive combination of the female and male losses.
* The equations for L<sub>F</sub> and L<sub>M</sub> appear to be related to a Gaussian distribution, with σ<sub>f</sub> and σ<sub>M</sub> representing standard deviations for female and male predictions, respectively.
### Interpretation
This diagram represents a sophisticated multimodal learning system designed to perform multiple tasks while mitigating gender bias. The architecture leverages the strengths of different neural network layers (CNNs for spatial features, BiLSTMs for temporal dependencies, and FC layers for final prediction). The U-Fair loss function is a key component, aiming to ensure fairness by penalizing discrepancies in performance between female and male predictions. The equations suggest that the loss function is designed to minimize the variance and maximize the likelihood of correct predictions for both genders. The use of separate loss terms for each gender allows the model to learn representations that are less susceptible to bias. The diagram highlights a growing trend in machine learning research towards developing fair and unbiased AI systems.