## Line Graphs: Effective Rank Comparison (2.5B)
### Overview
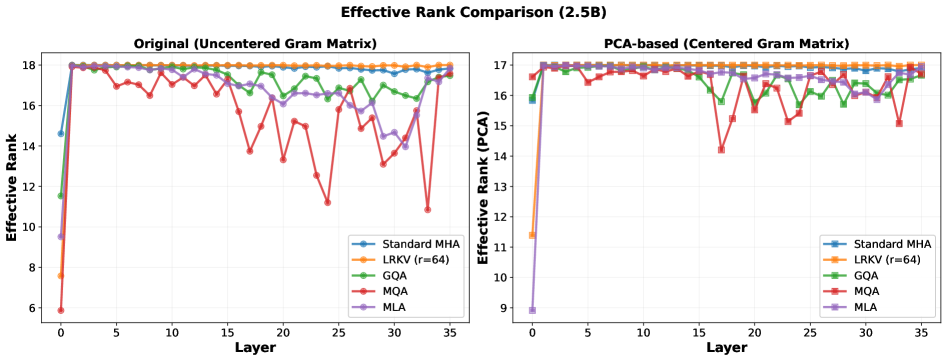
The image contains two side-by-side line graphs comparing the effective rank of different attention mechanisms across layers. The left graph uses an "Original (Uncentered Gram Matrix)" and the right graph uses a "PCA-based (Centered Gram Matrix)". Both graphs show the effective rank (y-axis) as a function of layer (x-axis), with five distinct data series representing different methods.
### Components/Axes
- **X-axis (Layer)**: Ranges from 0 to 35, labeled "Layer".
- **Y-axis (Effective Rank)**: Ranges from 6 to 18, labeled "Effective Rank (PCA)" for the right graph and "Effective Rank" for the left graph.
- **Legends**:
- **Left Graph (Original)**:
- Standard MHA: Blue
- LRKV (r=64): Orange
- GQA: Green
- MQA: Red
- MLA: Purple
- **Right Graph (PCA-based)**:
- Standard MHA: Blue
- LRKV (r=64): Orange
- GQA: Green
- MQA: Red
- MLA: Purple
- **Graph Titles**:
- Left: "Original (Uncentered Gram Matrix)"
- Right: "PCA-based (Centered Gram Matrix)"
### Detailed Analysis
#### Left Graph (Original)
- **Standard MHA (Blue)**: Starts at ~14 (layer 0), rises sharply to ~18 by layer 1, then fluctuates slightly around 18.
- **LRKV (r=64) (Orange)**: Starts at ~7 (layer 0), rises sharply to ~18 by layer 1, then stabilizes.
- **GQA (Green)**: Starts at ~11 (layer 0), rises sharply to ~18 by layer 1, then fluctuates slightly.
- **MQA (Red)**: Starts at ~6 (layer 0), rises sharply to ~18 by layer 1, then shows significant dips (e.g., ~12 at layer 15, ~14 at layer 25).
- **MLA (Purple)**: Starts at ~9 (layer 0), rises sharply to ~18 by layer 1, then fluctuates slightly.
#### Right Graph (PCA-based)
- **Standard MHA (Blue)**: Starts at ~16 (layer 0), rises sharply to ~17 by layer 1, then stabilizes.
- **LRKV (r=64) (Orange)**: Starts at ~11 (layer 0), rises sharply to ~17 by layer 1, then stabilizes.
- **GQA (Green)**: Starts at ~13 (layer 0), rises sharply to ~17 by layer 1, then fluctuates slightly.
- **MQA (Red)**: Starts at ~9 (layer 0), rises sharply to ~17 by layer 1, then shows significant dips (e.g., ~15 at layer 15, ~16 at layer 25).
- **MLA (Purple)**: Starts at ~9 (layer 0), rises sharply to ~17 by layer 1, then stabilizes.
### Key Observations
1. **Convergence**: All methods converge to similar effective ranks (~18 in the original graph, ~17 in the PCA-based graph) after the first layer (layer 1).
2. **Initial Variability**: The original graph shows greater variability in starting effective ranks (6–14) compared to the PCA-based graph (9–16).
3. **MQA Anomalies**: MQA (red) exhibits the most pronounced dips in both graphs, suggesting potential instability or sensitivity to layer-specific factors.
4. **PCA Impact**: The PCA-based graph shows slightly lower effective ranks overall, indicating possible differences in information retention or dimensionality reduction effects.
### Interpretation
The data suggests that the effective rank of attention mechanisms stabilizes after the first layer, regardless of the Gram matrix type. The PCA-based approach results in marginally lower effective ranks, which could imply more efficient or constrained information encoding. The MQA method's sharp initial rise and subsequent dips highlight its sensitivity to layer-specific dynamics, potentially indicating overfitting or suboptimal performance in certain layers. The convergence of all methods after layer 1 underscores the robustness of these attention mechanisms in capturing information, while the PCA-based approach may offer a trade-off between efficiency and rank preservation.