## Chart: Expert Human Preference Win Rates (Aggregated Across Stages)
### Overview
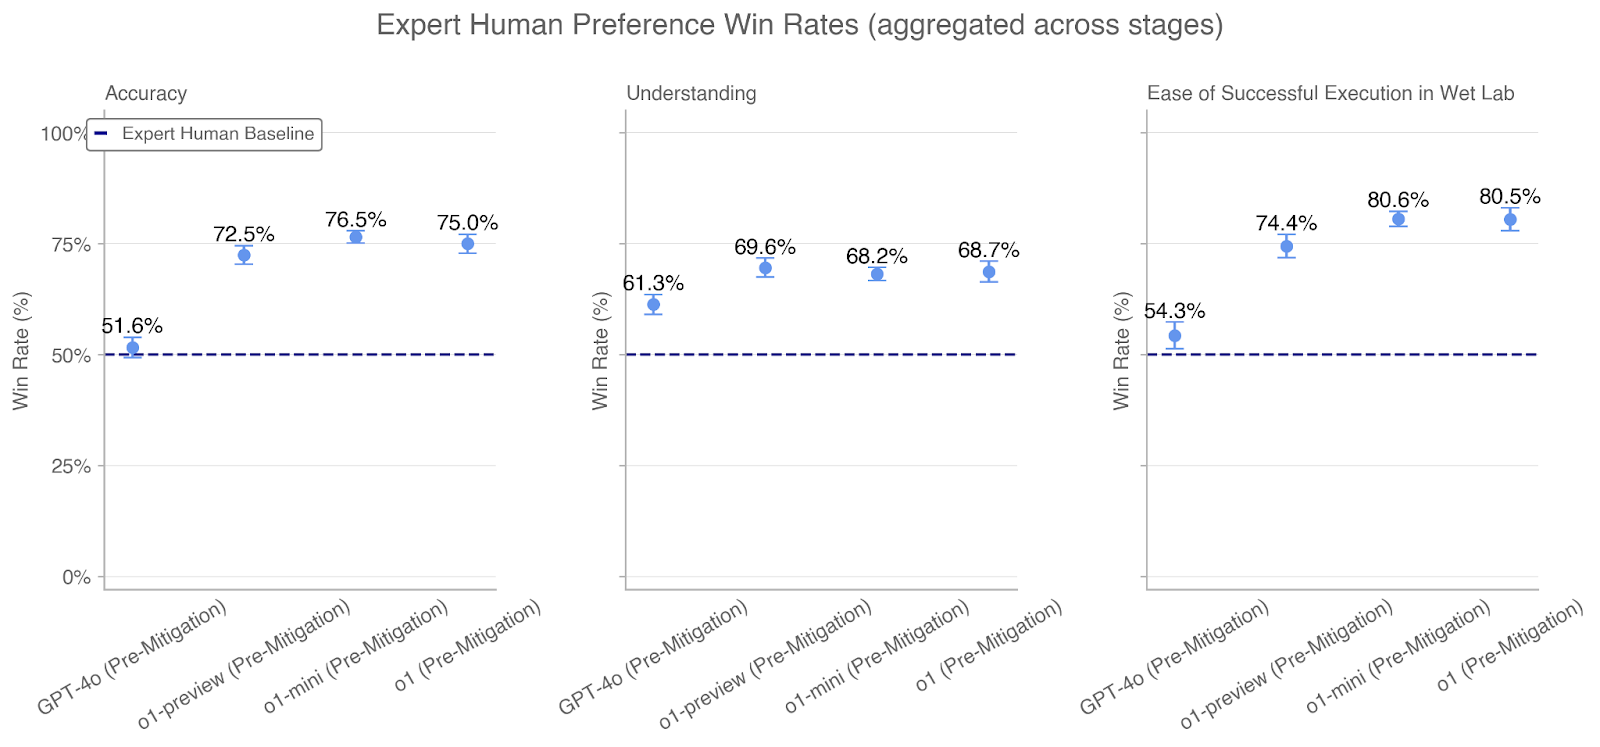
The image displays a set of three related dot plots comparing the performance of four AI models against an "Expert Human Baseline" across three evaluation metrics. The overall title is "Expert Human Preference Win Rates (aggregated across stages)". The three metrics, presented as separate subplots from left to right, are: **Accuracy**, **Understanding**, and **Ease of Successful Execution in Wet Lab**. The data shows the win rate percentage for each model, with a consistent baseline for comparison.
### Components/Axes
* **Main Title:** "Expert Human Preference Win Rates (aggregated across stages)"
* **Subplot Titles (Left to Right):**
1. "Accuracy"
2. "Understanding"
3. "Ease of Successful Execution in Wet Lab"
* **Y-Axis (All Subplots):** Labeled "Win Rate (%)". The scale runs from 0% to 100%, with major tick marks at 0%, 25%, 50%, 75%, and 100%.
* **X-Axis (All Subplots):** Lists four model variants. The labels are rotated approximately 45 degrees. From left to right:
1. "GPT-4o (Pre-Mitigation)"
2. "o1-preview (Pre-Mitigation)"
3. "o1-mini (Pre-Mitigation)"
4. "o1 (Pre-Mitigation)"
* **Legend:** Located in the top-left corner of the "Accuracy" subplot. It contains a single entry: a dark blue dashed line labeled "Expert Human Baseline". This dashed line is drawn horizontally across all three subplots at the 50% win rate mark.
* **Data Points:** Each model's performance is represented by a light blue circular dot with a small vertical error bar. The exact percentage value is printed directly above each dot.
### Detailed Analysis
**1. Accuracy Subplot (Left):**
* **Trend:** Win rates increase from the first model (GPT-4o) to the second (o1-preview), then plateau for the last two models (o1-mini, o1).
* **Data Points:**
* GPT-4o (Pre-Mitigation): **51.6%** (Slightly above the 50% baseline)
* o1-preview (Pre-Mitigation): **72.5%**
* o1-mini (Pre-Mitigation): **76.5%**
* o1 (Pre-Mitigation): **75.0%**
**2. Understanding Subplot (Center):**
* **Trend:** Win rates show a moderate increase from GPT-4o to o1-preview, then remain relatively flat for the subsequent models.
* **Data Points:**
* GPT-4o (Pre-Mitigation): **61.3%**
* o1-preview (Pre-Mitigation): **69.6%**
* o1-mini (Pre-Mitigation): **68.2%**
* o1 (Pre-Mitigation): **68.7%**
**3. Ease of Successful Execution in Wet Lab Subplot (Right):**
* **Trend:** A sharp increase in win rate from GPT-4o to o1-preview, followed by a further increase to o1-mini, with o1 performing nearly identically to o1-mini.
* **Data Points:**
* GPT-4o (Pre-Mitigation): **54.3%**
* o1-preview (Pre-Mitigation): **74.4%**
* o1-mini (Pre-Mitigation): **80.6%**
* o1 (Pre-Mitigation): **80.5%**
### Key Observations
1. **Baseline Comparison:** All models across all three metrics perform above the "Expert Human Baseline" of 50%. The lowest win rate is 51.6% (GPT-4o in Accuracy), and the highest is 80.6% (o1-mini in Wet Lab Execution).
2. **Model Progression:** There is a consistent pattern where GPT-4o (Pre-Mitigation) has the lowest win rate in every category. The "o1" series models (preview, mini, and full) show significantly higher performance.
3. **Metric Sensitivity:** The "Ease of Successful Execution in Wet Lab" metric shows the largest performance gap between GPT-4o (~54%) and the top-performing o1 models (~80.5%), suggesting this task differentiates the models most strongly.
4. **Performance Plateau:** For the "Accuracy" and "Understanding" metrics, the performance gain from o1-preview to o1-mini/o1 is minimal or negative, indicating a potential plateau. In contrast, "Wet Lab Execution" shows a continued, albeit smaller, gain from o1-preview to o1-mini.
5. **Closest Models:** The "o1-mini" and "o1" models perform very similarly across all metrics, with differences of 1.5% or less.
### Interpretation
This chart presents a comparative evaluation of AI model performance in specialized, likely scientific or technical, tasks as judged by expert human preference. The "Pre-Mitigation" label suggests these are baseline model versions before safety or alignment adjustments.
The data demonstrates that the newer "o1" family of models substantially outperforms the GPT-4o model in all evaluated dimensions, particularly in the practical application of executing procedures in a wet lab environment. The fact that win rates are aggregated "across stages" implies the evaluation involved multi-step processes, not just single-turn queries.
The consistent outperformance of the 50% human baseline indicates that, in this specific evaluation framework, experts preferred the AI's output over a hypothetical equal-probability chance between AI and human. The high scores in "Wet Lab Execution" are especially notable, as they suggest the models are not just providing accurate information but are generating outputs that experts deem more successfully executable in a real-world, hands-on context. The plateau in "Accuracy" and "Understanding" for the top models may indicate these metrics are approaching a ceiling within the current evaluation paradigm, or that further model improvements are yielding diminishing returns in these specific areas compared to applied execution.