## Heatmap Matrix: Performance Metrics for Backdoor and Targeted Vulnerability/Mitigation
### Overview
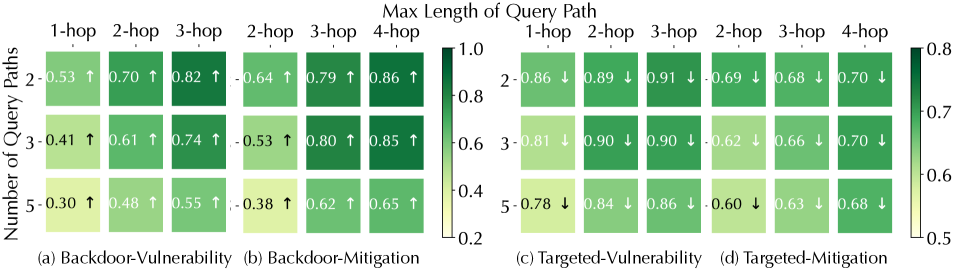
The image presents a matrix of four heatmaps, labeled (a) through (d), illustrating performance metrics across different query configurations. The charts analyze the relationship between the "Number of Query Paths" (rows: 2, 3, 5) and the "Max Length of Query Path" (columns: 1-hop, 2-hop, 3-hop, 4-hop). The data is divided into two categories: "Backdoor" (a, b) and "Targeted" (c, d), with each category showing both "Vulnerability" and "Mitigation" metrics.
### Components/Axes
* **Y-Axis (Left):** "Number of Query Paths" with discrete values: 2, 3, and 5.
* **X-Axis (Top):** "Max Length of Query Path" with discrete values:
* For (a) and (b): 1-hop, 2-hop, 3-hop.
* For (c) and (d): 2-hop, 3-hop, 4-hop.
* **Legends:**
* **Left Legend (for a & b):** A color scale ranging from 0.2 (light yellow-green) to 1.0 (dark green).
* **Right Legend (for c & d):** A color scale ranging from 0.5 (light yellow-green) to 0.8 (dark green).
* **Symbols:**
* Charts (a) and (b) contain upward-pointing arrows ($\uparrow$) in every cell.
* Charts (c) and (d) contain downward-pointing arrows ($\downarrow$) in every cell.
### Detailed Analysis
#### (a) Backdoor-Vulnerability
* **Trend:** Values increase as the hop count increases (left to right) and decrease as the number of query paths increases (top to bottom).
* **Data Points:**
* Row 2: 0.53 (1-hop), 0.70 (2-hop), 0.82 (3-hop)
* Row 3: 0.41 (1-hop), 0.61 (2-hop), 0.74 (3-hop)
* Row 5: 0.30 (1-hop), 0.48 (2-hop), 0.55 (3-hop)
#### (b) Backdoor-Mitigation
* **Trend:** Similar to (a), values increase with hop count and decrease with the number of query paths.
* **Data Points:**
* Row 2: 0.64 (1-hop), 0.79 (2-hop), 0.86 (3-hop)
* Row 3: 0.53 (1-hop), 0.80 (2-hop), 0.85 (3-hop)
* Row 5: 0.38 (1-hop), 0.62 (2-hop), 0.65 (3-hop)
#### (c) Targeted-Vulnerability
* **Trend:** Values are consistently high. There is a slight increase as hop count increases and a slight decrease as the number of query paths increases.
* **Data Points:**
* Row 2: 0.86 (2-hop), 0.89 (3-hop), 0.91 (4-hop)
* Row 3: 0.81 (2-hop), 0.90 (3-hop), 0.90 (4-hop)
* Row 5: 0.78 (2-hop), 0.84 (3-hop), 0.86 (4-hop)
#### (d) Targeted-Mitigation
* **Trend:** Values are lower than in (c). There is a slight increase as hop count increases and a slight decrease as the number of query paths increases.
* **Data Points:**
* Row 2: 0.69 (2-hop), 0.68 (3-hop), 0.70 (4-hop)
* Row 3: 0.62 (2-hop), 0.66 (3-hop), 0.70 (4-hop)
* Row 5: 0.60 (2-hop), 0.63 (3-hop), 0.68 (4-hop)
### Key Observations
* **Metric Sensitivity:** The "Backdoor" metrics (a, b) show a wider variance (0.30 to 0.86) compared to the "Targeted" metrics (c, d), which are more tightly clustered (0.60 to 0.91).
* **Inverse Relationship:** In all four charts, increasing the "Number of Query Paths" (moving down the rows) consistently results in lower values, suggesting that higher path counts may dilute the effect or increase the difficulty of the task.
* **Positive Correlation with Hops:** Increasing the "Max Length of Query Path" (moving across the columns) consistently results in higher values, suggesting that longer paths are more effective or impactful for both vulnerability and mitigation.
### Interpretation
The data suggests that the system's vulnerability and mitigation effectiveness are highly dependent on the geometry of the query path.
* **Backdoor Analysis:** The "Backdoor" vulnerability (a) is significantly mitigated by the "Backdoor-Mitigation" (b) strategy, as evidenced by the higher values in (b) compared to (a) across corresponding cells. The upward arrows ($\uparrow$) likely denote that higher values are "better" or "more successful" in this context.
* **Targeted Analysis:** The "Targeted-Vulnerability" (c) shows very high values (approaching 0.9), indicating the system is highly susceptible to targeted attacks. The "Targeted-Mitigation" (d) values are lower than (c), which, given the downward arrows ($\downarrow$), suggests that the mitigation strategy is successfully reducing the vulnerability metric.
* **Summary:** The system is more vulnerable to targeted attacks than backdoor attacks, but the mitigation strategies appear to be functioning as intended by reducing the vulnerability metrics in the targeted scenario.