\n
## Heatmap: Query Path Length vs. Attack Success Rate
### Overview
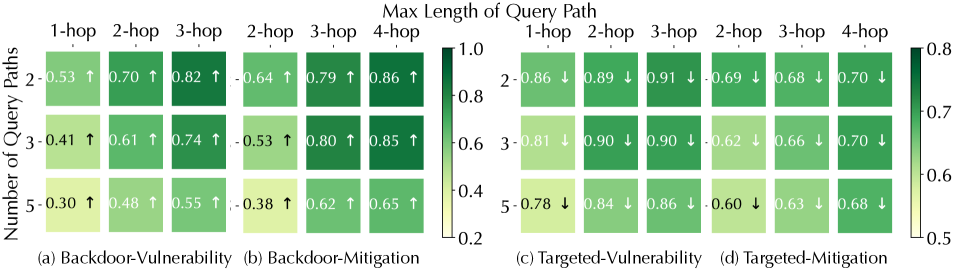
The image presents a comparative heatmap illustrating the success rate of backdoor and targeted attacks based on the maximum length of the query path. The heatmap is divided into four sections, each representing a different attack scenario: Backdoor-Vulnerability, Backdoor-Mitigation, Targeted-Vulnerability, and Targeted-Mitigation. The y-axis represents the number of query paths, ranging from 1 to 5, while the x-axis represents the maximum length of the query path, ranging from 1-hop to 4-hop. The color intensity indicates the attack success rate, with darker shades of green representing higher success rates and lighter shades representing lower success rates. Arrows indicate the trend of success rate as the query path length increases.
### Components/Axes
* **Title:** Max Length of Query Path
* **Y-axis Title:** Number of Query Paths (1-5)
* **X-axis Title:** Max Length of Query Path (1-hop, 2-hop, 3-hop, 4-hop)
* **Color Scale:** Ranges from 0.2 (light green) to 1.0 (dark green), representing attack success rate.
* **Labels:**
* (a) Backdoor-Vulnerability
* (b) Backdoor-Mitigation
* (c) Targeted-Vulnerability
* (d) Targeted-Mitigation
* **Trend Indicators:** Upward arrows (↑) indicate an increasing success rate with increasing query path length, while downward arrows (↓) indicate a decreasing success rate.
### Detailed Analysis
**Section (a): Backdoor-Vulnerability**
* 1 Query Path: 0.53 ↑
* 2 Query Paths: 0.70 ↑
* 3 Query Paths: 0.82 ↑
* 1-hop: 0.53
* 2-hop: 0.70
* 3-hop: 0.82
* 4-hop: Not present
**Section (b): Backdoor-Mitigation**
* 1 Query Path: 0.38 ↑
* 2 Query Paths: 0.64 ↑
* 3 Query Paths: 0.79 ↑
* 4 Query Paths: 0.86 ↑
* 1-hop: 0.38
* 2-hop: 0.64
* 3-hop: 0.79
* 4-hop: 0.86
**Section (c): Targeted-Vulnerability**
* 1 Query Path: 0.86 ↓
* 2 Query Paths: 0.89 ↓
* 3 Query Paths: 0.90 ↓
* 4 Query Paths: 0.68 ↓
* 1-hop: 0.86
* 2-hop: 0.89
* 3-hop: 0.90
* 4-hop: 0.68
**Section (d): Targeted-Mitigation**
* 1 Query Path: 0.78 ↓
* 2 Query Paths: 0.81 ↓
* 3 Query Paths: 0.86 ↓
* 4 Query Paths: 0.63 ↓
* 1-hop: 0.78
* 2-hop: 0.81
* 3-hop: 0.86
* 4-hop: 0.63
### Key Observations
* **Backdoor Attacks:** The success rate of backdoor attacks generally *increases* with the length of the query path (Sections a and b). Mitigation strategies (Section b) show lower initial success rates but still exhibit an upward trend.
* **Targeted Attacks:** The success rate of targeted attacks generally *decreases* with the length of the query path (Sections c and d). Mitigation strategies (Section d) also show a decreasing trend, but start at a lower success rate than the vulnerability scenario (Section c).
* **Mitigation Impact:** Mitigation strategies consistently reduce the success rate of both backdoor and targeted attacks compared to their vulnerable counterparts.
* **Peak Success:** Targeted-Vulnerability (Section c) shows the highest success rates, peaking at 0.90 for 3-hop queries.
### Interpretation
The data suggests that longer query paths are more effective for exploiting backdoor vulnerabilities, while they are detrimental to targeted attacks. This could be due to the nature of backdoor triggers, which may require a certain sequence or length of queries to activate. Conversely, targeted attacks may become less precise or more detectable with longer, more complex query paths.
The mitigation strategies demonstrate a clear benefit in reducing attack success rates, but their effectiveness varies depending on the attack type and query path length. The consistent downward trend in targeted attack success rates with mitigation suggests that these strategies are effective in disrupting precision attacks. The increasing success rate of backdoor attacks with mitigation, despite being lower than the vulnerable scenario, indicates that further refinement of mitigation techniques may be needed to address this threat.
The heatmap provides valuable insights into the trade-offs between query path length, attack success rate, and mitigation effectiveness. This information can be used to design more robust security systems and develop targeted mitigation strategies. The anomalies, such as the peak success rate for Targeted-Vulnerability at 3-hop, warrant further investigation to understand the underlying mechanisms driving these results.