## [Heatmap Series]: Vulnerability and Mitigation Analysis Across Query Path Lengths
### Overview
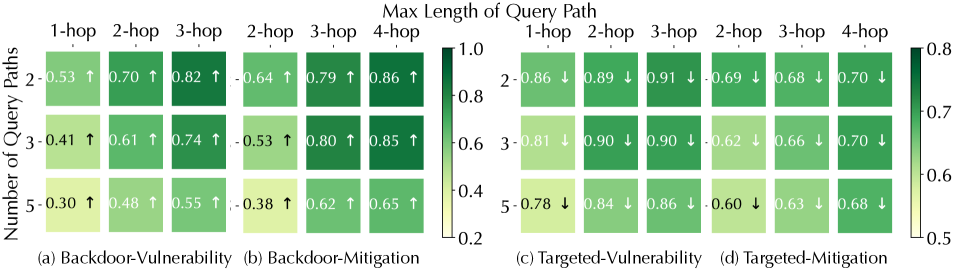
The image displays a set of four heatmaps arranged in a 2x2 grid, analyzing the relationship between the "Number of Query Paths" (y-axis) and the "Max Length of Query Path" (x-axis) for different security scenarios. Each heatmap uses a color gradient (light yellow to dark green) to represent a numerical score, with arrows indicating the directional trend of the score as the number of query paths increases. The overall title is "Max Length of Query Path."
### Components/Axes
* **Main Title:** "Max Length of Query Path" (centered at the top).
* **Y-axis Label (Left):** "Number of Query Paths" (applies to all four subplots).
* **Y-axis Categories (Rows):** 2, 3, 5 (for each heatmap).
* **X-axis Categories (Columns):** Vary by subplot:
* (a) & (c): 1-hop, 2-hop, 3-hop
* (b) & (d): 2-hop, 3-hop, 4-hop
* **Subplot Titles:**
* (a) Backdoor-Vulnerability
* (b) Backdoor-Mitigation
* (c) Targeted-Vulnerability
* (d) Targeted-Mitigation
* **Color Bars (Legends):**
* **Left Pair (a & b):** Scale from 0.2 (light yellow) to 1.0 (dark green). Positioned to the right of subplot (b).
* **Right Pair (c & d):** Scale from 0.5 (light yellow) to 0.8 (dark green). Positioned to the right of subplot (d).
* **Data Annotations:** Each cell contains a numerical value (to two decimal places) and an arrow (↑ or ↓).
### Detailed Analysis
**Subplot (a) Backdoor-Vulnerability:**
* **Trend:** Scores increase with both more query paths and longer path lengths (all arrows ↑).
* **Data Points:**
* Row "2": 1-hop: 0.53 ↑, 2-hop: 0.70 ↑, 3-hop: 0.82 ↑
* Row "3": 1-hop: 0.41 ↑, 2-hop: 0.61 ↑, 3-hop: 0.74 ↑
* Row "5": 1-hop: 0.30 ↑, 2-hop: 0.48 ↑, 3-hop: 0.55 ↑
**Subplot (b) Backdoor-Mitigation:**
* **Trend:** Scores increase with both more query paths and longer path lengths (all arrows ↑). Values are generally higher than in (a).
* **Data Points:**
* Row "2": 2-hop: 0.64 ↑, 3-hop: 0.79 ↑, 4-hop: 0.86 ↑
* Row "3": 2-hop: 0.53 ↑, 3-hop: 0.80 ↑, 4-hop: 0.85 ↑
* Row "5": 2-hop: 0.38 ↑, 3-hop: 0.62 ↑, 4-hop: 0.65 ↑
**Subplot (c) Targeted-Vulnerability:**
* **Trend:** Scores generally decrease as the number of query paths increases (all arrows ↓). Scores are high for 2 and 3 paths but drop for 5 paths.
* **Data Points:**
* Row "2": 1-hop: 0.86 ↓, 2-hop: 0.89 ↓, 3-hop: 0.91 ↓
* Row "3": 1-hop: 0.81 ↓, 2-hop: 0.90 ↓, 3-hop: 0.90 ↓
* Row "5": 1-hop: 0.78 ↓, 2-hop: 0.84 ↓, 3-hop: 0.86 ↓
**Subplot (d) Targeted-Mitigation:**
* **Trend:** Scores decrease as the number of query paths increases (all arrows ↓). Values are lower than in (c).
* **Data Points:**
* Row "2": 2-hop: 0.69 ↓, 3-hop: 0.68 ↓, 4-hop: 0.70 ↓
* Row "3": 2-hop: 0.62 ↓, 3-hop: 0.66 ↓, 4-hop: 0.70 ↓
* Row "5": 2-hop: 0.60 ↓, 3-hop: 0.63 ↓, 4-hop: 0.68 ↓
### Key Observations
1. **Opposing Trends:** Backdoor scenarios (a, b) show a positive correlation between score and query path complexity (more paths/longer hops = higher score). Targeted scenarios (c, d) show a negative correlation (more paths = lower score).
2. **Magnitude Differences:** Vulnerability scores (a, c) are generally higher than their corresponding Mitigation scores (b, d) within the same attack type (Backdoor or Targeted).
3. **Scale Discrepancy:** The color scales differ between the left (0.2-1.0) and right (0.5-0.8) pairs, indicating the data for Targeted attacks operates within a narrower, higher baseline range.
4. **Consistent Direction:** Within each subplot, the directional trend (↑ or ↓) is uniform across all cells.
### Interpretation
This data suggests a fundamental difference in how backdoor and targeted attacks behave under increasing query complexity.
* **For Backdoor Attacks:** Both vulnerability and mitigation effectiveness increase with more and longer query paths. This could imply that backdoor triggers or their detection mechanisms become more pronounced or easier to identify when embedded within more complex query structures. The system's ability to mitigate (b) improves alongside the vulnerability (a), but mitigation scores are consistently higher, suggesting defenses are somewhat effective.
* **For Targeted Attacks:** The opposite occurs. Vulnerability and mitigation scores decrease as query paths multiply. This may indicate that targeted attacks become harder to execute successfully (lower vulnerability) or harder to defend against (lower mitigation) when the query structure is more complex and diffuse. The attack's precision might be diluted, but so might the defense's ability to pinpoint it.
* **Overall Implication:** The security posture of the system is highly dependent on the attack type. Defenses that work well for backdoor scenarios (where complexity aids detection) may be less effective for targeted scenarios, where complexity appears to hinder both the attack and the defense. The narrower score range for targeted attacks suggests their outcomes are less variable and more consistently challenging to address.