# Technical Document Extraction: Step Function Graph
## Axes and Labels
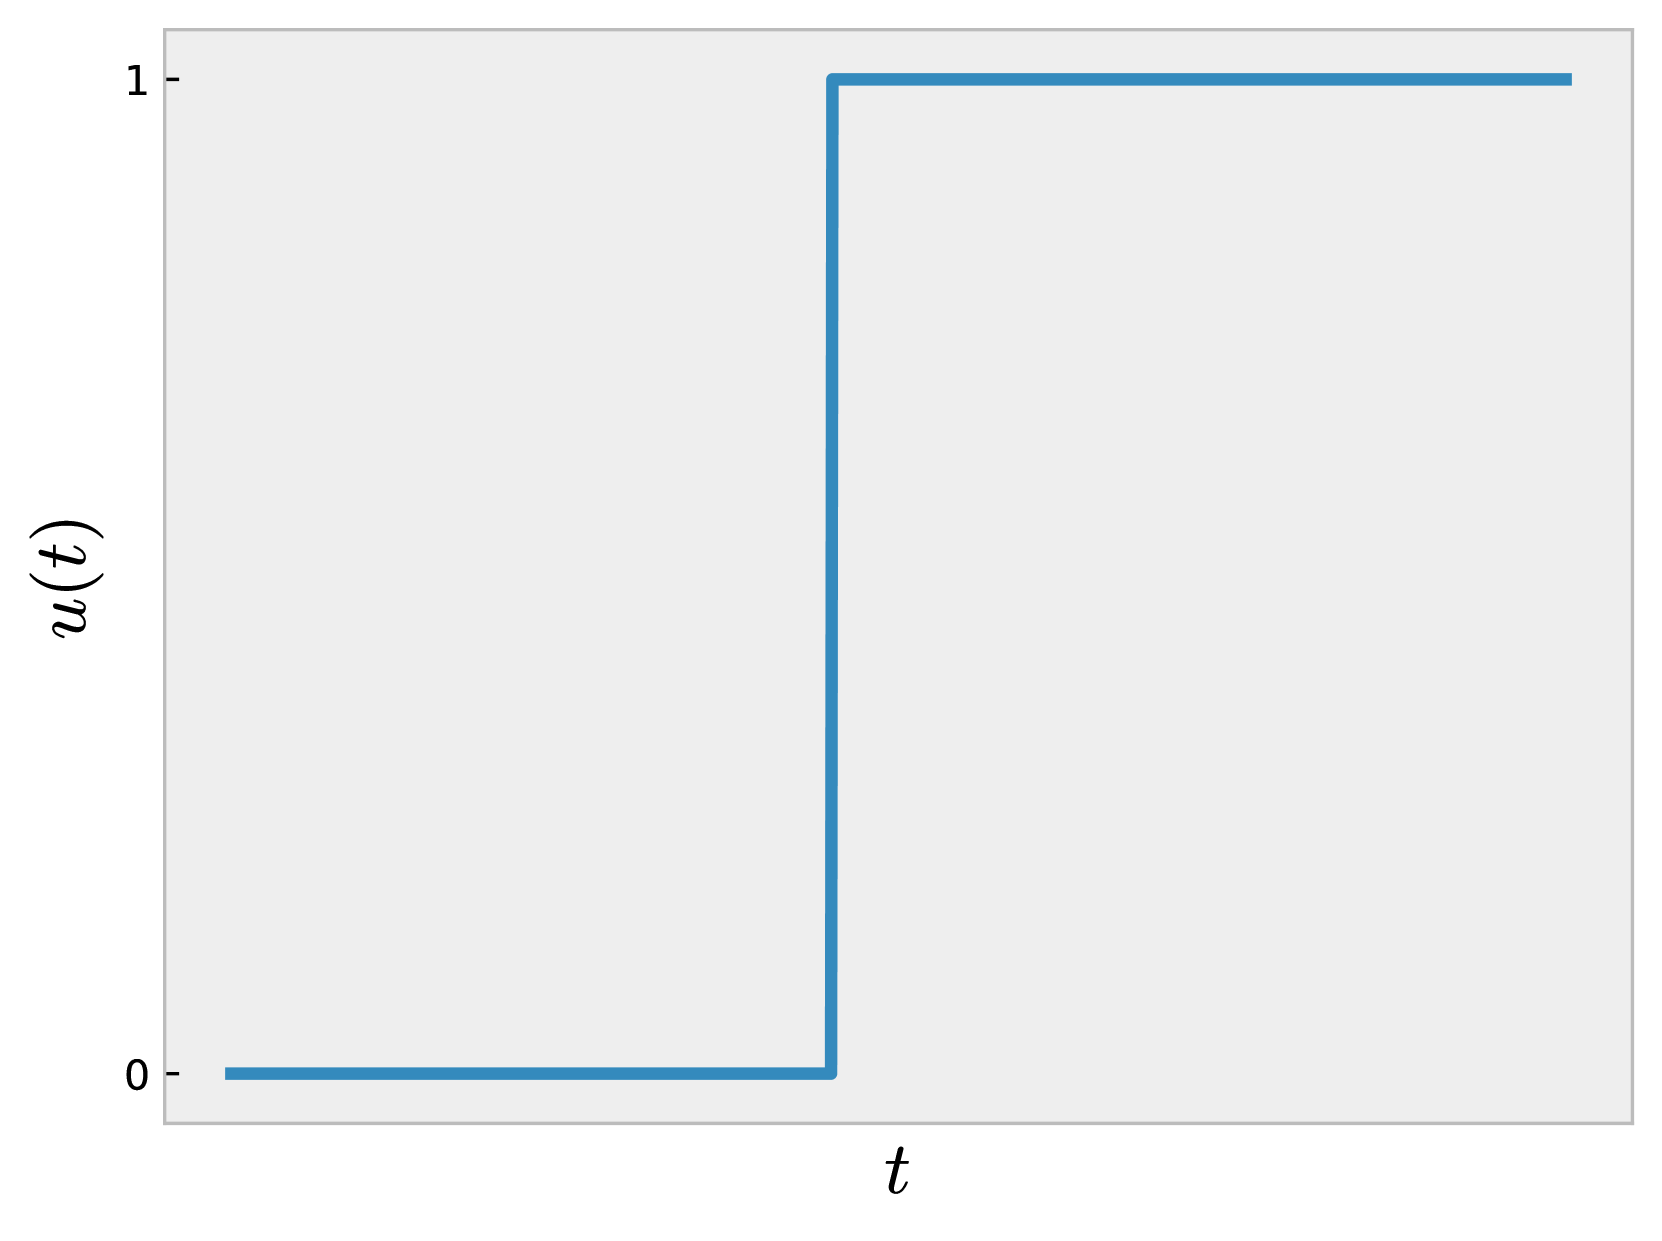
- **X-axis**: Labeled `t` (time variable).
- **Y-axis**: Labeled `u(t)` (function output).
## Key Data Points
1. **Point 1**: `(t=0, u(t)=0)`
- Horizontal line segment from `(0, 0)` to `(1, 0)`.
2. **Point 2**: `(t=1, u(t)=1)`
- Vertical jump from `(1, 0)` to `(1, 1)`.
3. **Point 3**: `(t→∞, u(t)=1)`
- Horizontal line segment from `(1, 1)` to the right edge of the plot.
## Graph Structure
- **Shape**: Step function (unit step function `u(t)`).
- Constant value `0` for `t < 1`.
- Constant value `1` for `t ≥ 1`.
- **Transition**: Abrupt vertical rise at `t=1`.
## Visual Details
- **Background**: Light gray (`#f0f0f0`).
- **Border**: Thin dark gray (`#cccccc`).
- **Line Color**: Blue (`#0000ff`).
- **Grid**: No grid lines present.
## Observations
- No legend, annotations, or additional text embedded in the plot.
- No data table or heatmap categories present.
- The function `u(t)` is a standard unit step function, commonly used in control systems and signal processing.
## Cross-Reference Check
- Axis labels (`t`, `u(t)`) match the plotted data points.
- No discrepancies in line placement or labels.
## Summary
The graph represents a unit step function `u(t)`, transitioning from `0` to `1` at `t=1`. All textual and structural elements have been extracted as described.