## Scatter Plot: AIME 2024 - Thinking Budget vs. Response Length
### Overview
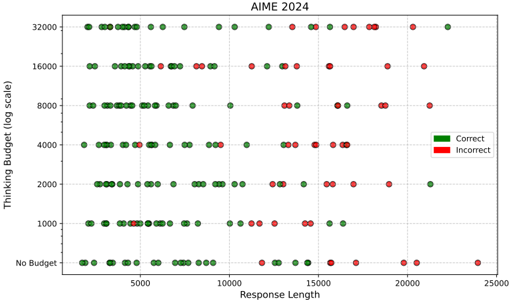
The image is a scatter plot titled "AIME 2024". It visualizes the relationship between "Thinking Budget" (on a logarithmic scale) and "Response Length". Data points are colored green for "Correct" and red for "Incorrect", indicating the accuracy of responses based on these two variables.
### Components/Axes
* **Title:** AIME 2024
* **X-axis:** Response Length, ranging from 0 to 25000. Axis markers are present at 5000, 10000, 15000, 20000, and 25000.
* **Y-axis:** Thinking Budget (log scale). Axis markers are present at "No Budget", 1000, 2000, 4000, 8000, 16000, and 32000.
* **Legend:** Located in the top-right corner.
* Green square: Correct
* Red square: Incorrect
### Detailed Analysis
* **Data Points:** Each data point represents a response, with its position determined by its response length (x-axis) and thinking budget (y-axis). The color indicates whether the response was correct (green) or incorrect (red).
* **Thinking Budget Levels:**
* **No Budget:** Data points are scattered across the response length, with a mix of correct and incorrect answers.
* **1000:** Similar distribution to "No Budget", with a mix of correct and incorrect answers across various response lengths.
* **2000:** Predominantly correct answers (green) are observed, with a few incorrect answers (red).
* **4000:** Mostly correct answers (green), with fewer incorrect answers (red) compared to lower budget levels.
* **8000:** Primarily correct answers (green), with very few incorrect answers (red).
* **16000:** Almost exclusively correct answers (green), with only a couple of incorrect answers (red).
* **32000:** Exclusively correct answers (green) are observed across all response lengths.
### Key Observations
* **Trend:** As the thinking budget increases, the proportion of correct answers generally increases.
* **Response Length:** There doesn't appear to be a strong correlation between response length and correctness, especially at lower thinking budget levels. At higher thinking budget levels, most responses are correct regardless of length.
* **Outliers:** There are a few incorrect answers (red) at higher thinking budget levels (16000), which could be considered outliers.
### Interpretation
The scatter plot suggests that the "Thinking Budget" has a positive impact on the correctness of responses. Higher thinking budgets are associated with a greater likelihood of correct answers. The "Response Length" does not appear to be a strong predictor of correctness, especially when the thinking budget is low. The outliers (incorrect answers at high thinking budgets) could be due to various factors not captured by these two variables, such as the complexity of the question or individual differences in problem-solving abilities. The data demonstrates that providing a higher "Thinking Budget" generally leads to more accurate responses, implying that time and resources allocated to thinking are beneficial for problem-solving in the context of AIME 2024.