\n
## Scatter Plot: AIME 2024 - Thinking Budget vs. Response Length
### Overview
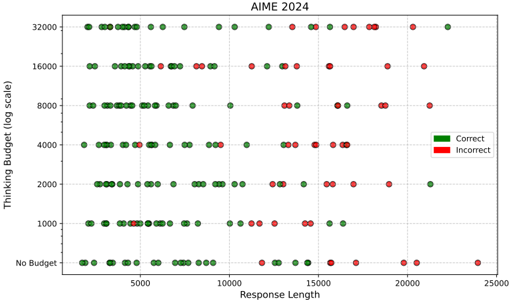
The image presents a scatter plot visualizing the relationship between "Thinking Budget" (on a logarithmic scale) and "Response Length" for AIME 2024 data. Each point on the plot represents a data instance, colored either green for "Correct" responses or red for "Incorrect" responses. The plot aims to show how the budget allocated for thinking and the length of the response correlate with the accuracy of the response.
### Components/Axes
* **Title:** AIME 2024 (top-center)
* **X-axis:** Response Length (ranging from approximately 0 to 25000)
* **Y-axis:** Thinking Budget (log scale) with labels: "No Budget", "1000", "2000", "4000", "8000", "16000", "32000"
* **Legend:** Located in the top-right corner.
* Green: Correct
* Red: Incorrect
### Detailed Analysis
The plot displays a large number of data points distributed across the range of both axes. The data points are clustered in bands corresponding to the discrete levels of the Thinking Budget.
Here's a breakdown of the data trends for each Thinking Budget level:
* **No Budget:** Almost all points are green ("Correct"). Approximately 1 data point at ~23000 Response Length is red ("Incorrect").
* **1000 Budget:** Predominantly green points. A few red points are scattered throughout the range of Response Length, with a slight concentration around 10000-15000.
* **2000 Budget:** Mostly green points. A small number of red points are present, again with a slight concentration around 10000-15000.
* **4000 Budget:** The majority of points are green. A few red points are scattered, with a slight increase in their number compared to the 2000 Budget level.
* **8000 Budget:** Predominantly green points. A moderate number of red points are present, distributed across the Response Length range.
* **16000 Budget:** A mix of green and red points. The proportion of red points appears to be higher than in the lower budget levels. There's a noticeable cluster of red points around 10000-15000 Response Length.
* **32000 Budget:** A significant mix of green and red points. The proportion of red points is substantial, and they are distributed across the entire Response Length range. There is a cluster of red points around 20000 Response Length.
**Approximate Data Points (sampled for illustration):**
* **No Budget:** ~1 green point at (5000, No Budget), ~1 red point at (23000, No Budget)
* **1000 Budget:** ~5 green points at (5000, 1000), ~2 red points at (12000, 1000)
* **2000 Budget:** ~8 green points at (5000, 2000), ~1 red point at (10000, 2000)
* **4000 Budget:** ~10 green points at (5000, 4000), ~3 red points at (15000, 4000)
* **8000 Budget:** ~12 green points at (5000, 8000), ~5 red points at (10000, 8000)
* **16000 Budget:** ~8 green points at (5000, 16000), ~7 red points at (12000, 16000)
* **32000 Budget:** ~6 green points at (5000, 32000), ~8 red points at (20000, 32000)
### Key Observations
* Responses with "No Budget" are overwhelmingly correct.
* As the Thinking Budget increases, the proportion of incorrect responses also tends to increase.
* There appears to be a "sweet spot" in terms of Response Length. Responses around 10000-15000 length have a higher concentration of incorrect answers, particularly at higher budget levels.
* At the highest budget level (32000), there's a relatively even distribution of correct and incorrect responses across the entire range of Response Length.
### Interpretation
The data suggests that simply increasing the "Thinking Budget" does not guarantee a correct response. In fact, beyond a certain point, a higher budget may be associated with a higher probability of an incorrect response. This could indicate that excessive deliberation or overthinking can be detrimental to accuracy.
The concentration of incorrect responses around a Response Length of 10000-15000 is intriguing. It might suggest that responses of this length are more prone to errors, perhaps due to complexity or a tendency to over-explain.
The strong performance with "No Budget" is a notable outlier. This could be due to several factors: the questions requiring quick, intuitive answers, or the participants being more confident in their initial responses when not given time to overthink.
The relationship between Thinking Budget and Response Length is complex. The plot doesn't reveal a simple correlation; instead, it highlights the interplay between these two factors and their impact on response accuracy. Further analysis, potentially including statistical tests, would be needed to confirm these observations and explore the underlying mechanisms.