## Scatter Plot: AIME 2024 - Thinking Budget vs. Response Length
### Overview
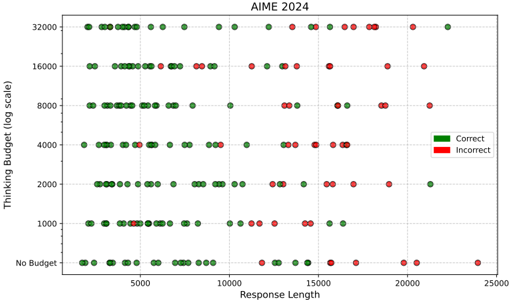
This image is a scatter plot titled "AIME 2024". It visualizes the relationship between a model's "Thinking Budget" (on a logarithmic scale) and the length of its generated "Response". Each data point represents a single evaluation instance, colored to indicate whether the model's final answer was "Correct" (green) or "Incorrect" (red).
### Components/Axes
* **Title:** "AIME 2024" (centered at the top).
* **Y-Axis:**
* **Label:** "Thinking Budget (log scale)" (rotated vertically on the left).
* **Scale:** Logarithmic. The labeled tick marks, from bottom to top, are: "No Budget", "1000", "2000", "4000", "8000", "16000", "32000".
* **X-Axis:**
* **Label:** "Response Length" (centered at the bottom).
* **Scale:** Linear. The labeled tick marks are: "0", "5000", "10000", "15000", "20000", "25000".
* **Legend:** Located in the top-right corner of the plot area.
* A green square labeled "Correct".
* A red square labeled "Incorrect".
* **Grid:** A light gray grid is present, aligning with the major tick marks on both axes.
### Detailed Analysis
The data is plotted across seven discrete "Thinking Budget" levels. For each level, the distribution of correct (green) and incorrect (red) responses across varying response lengths is shown.
1. **No Budget:**
* **Trend:** Data points span the entire range of response lengths (approx. 0 to 24,000).
* **Distribution:** Green (Correct) points are densely clustered at shorter response lengths (approx. 0 to 10,000). Red (Incorrect) points begin to appear around a length of 10,000 and become the dominant color for lengths beyond approximately 15,000. The longest responses (near 24,000) are all red.
2. **1000 Budget:**
* **Trend:** Similar spread to "No Budget", but with a slightly higher density of points in the mid-length range.
* **Distribution:** Green points are still concentrated below a length of ~12,000. Red points are interspersed but become more frequent as length increases, dominating the region beyond ~15,000.
3. **2000 Budget:**
* **Trend:** The cluster of points appears slightly more condensed in the mid-length range compared to lower budgets.
* **Distribution:** A clear mix of green and red across most lengths. Green points are still more common at shorter lengths, but red points are prevalent throughout, including at lengths as short as ~5,000.
4. **4000 Budget:**
* **Trend:** The point cloud shows a slight rightward shift, with fewer very short responses.
* **Distribution:** Red points are now very common across the entire spectrum. Green points are scattered but appear more frequently in the mid-length range (approx. 5,000 to 15,000).
5. **8000 Budget:**
* **Trend:** The distribution is similar to the 4000 budget level.
* **Distribution:** Red points are dominant. Green points are sparse and scattered, with no strong concentration by length.
6. **16000 Budget:**
* **Trend:** The number of data points appears lower than at mid-range budgets.
* **Distribution:** Predominantly red points. Very few green points are visible, scattered at various lengths.
7. **32000 Budget:**
* **Trend:** The sparsest set of data points.
* **Distribution:** Almost exclusively red points. Only one or two green points are visible (e.g., one near length 16,000).
### Key Observations
* **Inverse Relationship with Budget:** There is a clear visual trend where the proportion of green (Correct) points decreases as the Thinking Budget increases. The "No Budget" and "1000" budget levels have the highest density of correct answers.
* **Length Dependency at Low Budget:** For low or no thinking budget, correctness is strongly correlated with shorter response lengths. As length increases, the error rate rises sharply.
* **High Budget, High Error:** At the highest thinking budgets (16000, 32000), the vast majority of responses are incorrect, regardless of length.
* **Mid-Budget Ambiguity:** At intermediate budgets (2000, 4000, 8000), correctness is more mixed and less clearly tied to response length.
### Interpretation
This chart from the AIME 2024 evaluation suggests a counterintuitive relationship between allocated "thinking" resources and performance on this specific task.
* **The "Overthinking" Penalty:** The most striking finding is that increasing the model's thinking budget correlates with a *decrease* in accuracy. This could indicate that for the AIME benchmark, allowing the model more computational steps for internal reasoning leads it down unproductive or erroneous paths, a phenomenon sometimes called "overthinking" or "reasoning collapse."
* **Efficiency of Simplicity:** The best performance comes from models operating with minimal or no explicit thinking budget, producing relatively concise answers. This implies the task may reward direct, pattern-matching, or heuristic-based responses over deep, step-by-step reasoning.
* **Length as a Symptom, Not a Cause:** At low budgets, longer responses are more likely wrong. However, this is likely a symptom of the model struggling with harder problems (which require longer answers) rather than length itself causing errors. At high budgets, both short and long answers are frequently wrong, suggesting the thinking process itself is flawed.
* **Practical Implication:** For this class of problem (AIME mathematics), the optimal strategy may involve constraining the model's reasoning process to prevent it from becoming counterproductive. More compute for "thinking" does not equate to better results and is, in fact, detrimental within the tested range.