## Scatter Plot: AIME 2024 Performance by Response Length and Thinking Budget
### Overview
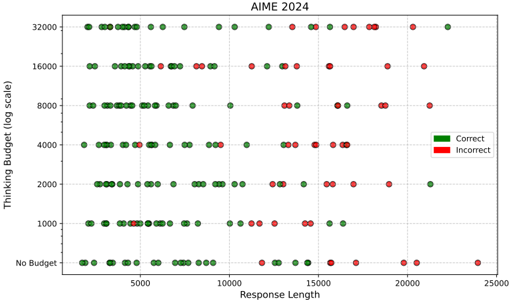
The image is a scatter plot titled "AIME 2024," visualizing the relationship between **response length** (x-axis) and **thinking budget** (y-axis, log scale). Data points are color-coded: **green** for correct answers and **red** for incorrect answers. The plot reveals patterns in how response length and computational resources (thinking budget) correlate with accuracy.
---
### Components/Axes
- **X-axis (Response Length)**:
- Range: 0 to 25,000 (linear scale, increments of 5,000).
- Labels: "No Budget," "1,000," "2,000," "4,000," "8,000," "16,000," "32,000" (y-axis categories).
- **Y-axis (Thinking Budget)**:
- Log scale from 1,000 to 32,000 (logarithmic increments: 1,000, 2,000, 4,000, 8,000, 16,000, 32,000).
- **Legend**:
- **Green**: Correct answers.
- **Red**: Incorrect answers.
- Positioned in the top-right corner.
---
### Detailed Analysis
1. **Response Length vs. Thinking Budget**:
- **Green Dots (Correct)**:
- Clustered predominantly at **lower response lengths** (5,000–10,000) across all thinking budgets.
- At higher response lengths (>15,000), green dots are sparse but present at mid-to-high budgets (e.g., 8,000–32,000).
- **Red Dots (Incorrect)**:
- Dominant at **higher response lengths** (15,000–25,000), especially at lower budgets (1,000–4,000).
- At higher budgets (8,000–32,000), red dots are less frequent but still present.
2. **Key Data Points**:
- **No Budget**:
- Green dots dominate at response lengths 5,000–10,000.
- Red dots appear sporadically at 15,000–20,000.
- **1,000 Budget**:
- Green dots peak at 5,000–10,000; red dots increase at 15,000–20,000.
- **32,000 Budget**:
- Green dots persist at 5,000–15,000; red dots appear at 20,000–25,000.
---
### Key Observations
1. **Inverse Relationship Between Response Length and Accuracy**:
- Longer responses (>15,000) correlate with higher error rates (red dots), even at high thinking budgets.
- Shorter responses (5,000–10,000) are more likely to be correct (green dots), regardless of budget.
2. **Budget Impact**:
- Higher thinking budgets (8,000–32,000) reduce but do not eliminate errors at long response lengths.
- At "No Budget," errors spike sharply for responses >15,000.
3. **Outliers**:
- A few red dots at low response lengths (e.g., 5,000) suggest occasional errors in short responses, possibly due to oversimplification.
---
### Interpretation
The data suggests that **longer responses do not guarantee higher accuracy** and may even increase error rates, particularly when computational resources (thinking budget) are limited. While higher budgets mitigate errors at long response lengths, they do not eliminate them entirely. This implies a trade-off: longer responses might reflect overthinking or inefficiency, while shorter responses could represent focused, effective reasoning. The log scale on the y-axis highlights that even small increases in thinking budget (e.g., 1,000 to 2,000) have diminishing returns on accuracy at longer response lengths. The presence of green dots at high response lengths (e.g., 20,000) at 32,000 budget indicates that optimal performance requires balancing both response length and resource allocation.