## Line Chart: Pass@1 Accuracy vs. Threshold
### Overview
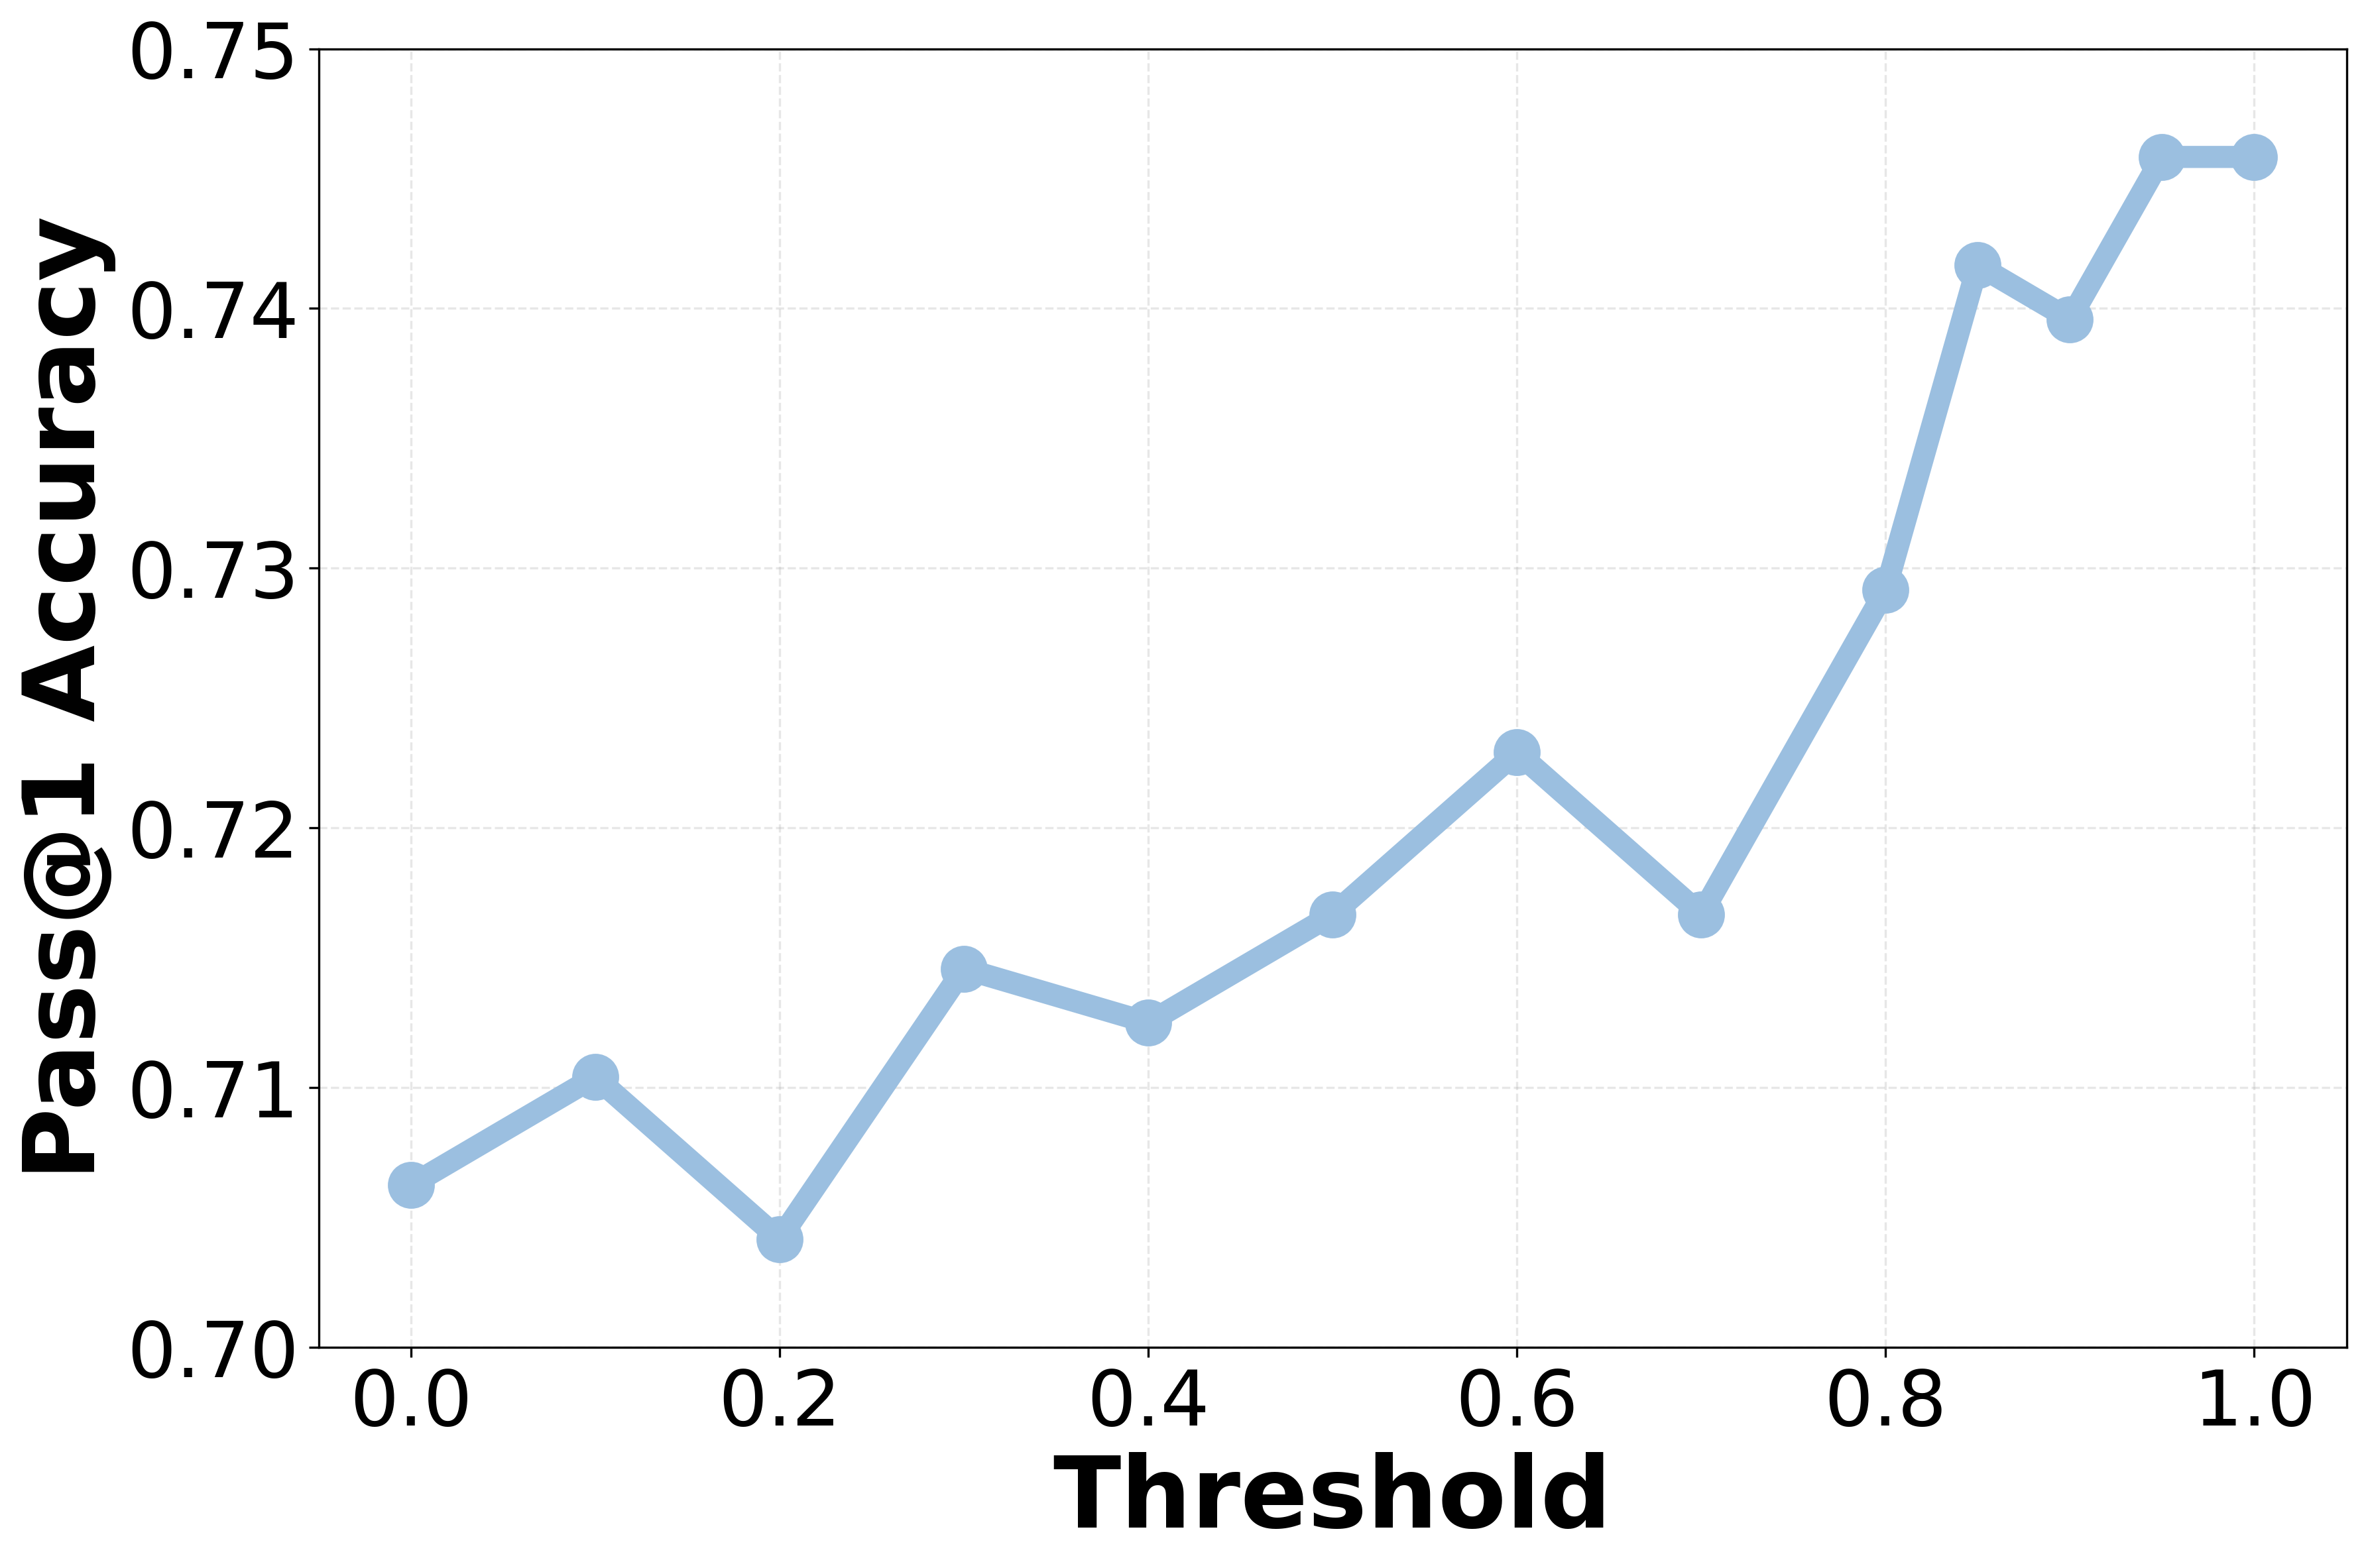
The image is a line chart showing the relationship between "Threshold" (x-axis) and "Pass@1 Accuracy" (y-axis). The chart displays a single data series represented by a light blue line with circular markers. The background has a light gray grid.
### Components/Axes
* **X-axis (Horizontal):** "Threshold" with values ranging from 0.0 to 1.0, incrementing by 0.2.
* **Y-axis (Vertical):** "Pass@1 Accuracy" with values ranging from 0.70 to 0.75, incrementing by 0.01.
* **Data Series:** A single light blue line with circular markers representing the Pass@1 Accuracy at different threshold values.
### Detailed Analysis
The light blue line represents the Pass@1 Accuracy.
* **Threshold 0.0:** Pass@1 Accuracy is approximately 0.706.
* **Threshold 0.2:** Pass@1 Accuracy is approximately 0.704.
* **Threshold 0.4:** Pass@1 Accuracy is approximately 0.712.
* **Threshold 0.6:** Pass@1 Accuracy is approximately 0.723.
* **Threshold 0.8:** Pass@1 Accuracy is approximately 0.741.
* **Threshold 1.0:** Pass@1 Accuracy is approximately 0.746.
The trend of the light blue line is initially decreasing slightly from 0.0 to 0.2, then generally increasing from 0.2 to 1.0.
### Key Observations
* The Pass@1 Accuracy generally increases as the Threshold increases from 0.2 to 1.0.
* There is a slight dip in Pass@1 Accuracy between Threshold 0.0 and 0.2.
* The highest Pass@1 Accuracy is observed at Threshold 1.0.
### Interpretation
The chart suggests that increasing the threshold generally improves the Pass@1 Accuracy, with a slight initial decrease at very low threshold values. This indicates that a higher threshold is generally beneficial for achieving better accuracy, up to the maximum threshold value of 1.0 shown in the chart. The initial dip might suggest that very low thresholds introduce some noise or instability in the system being evaluated.