\n
## Line Chart: Pass@1 Accuracy vs. Threshold
### Overview
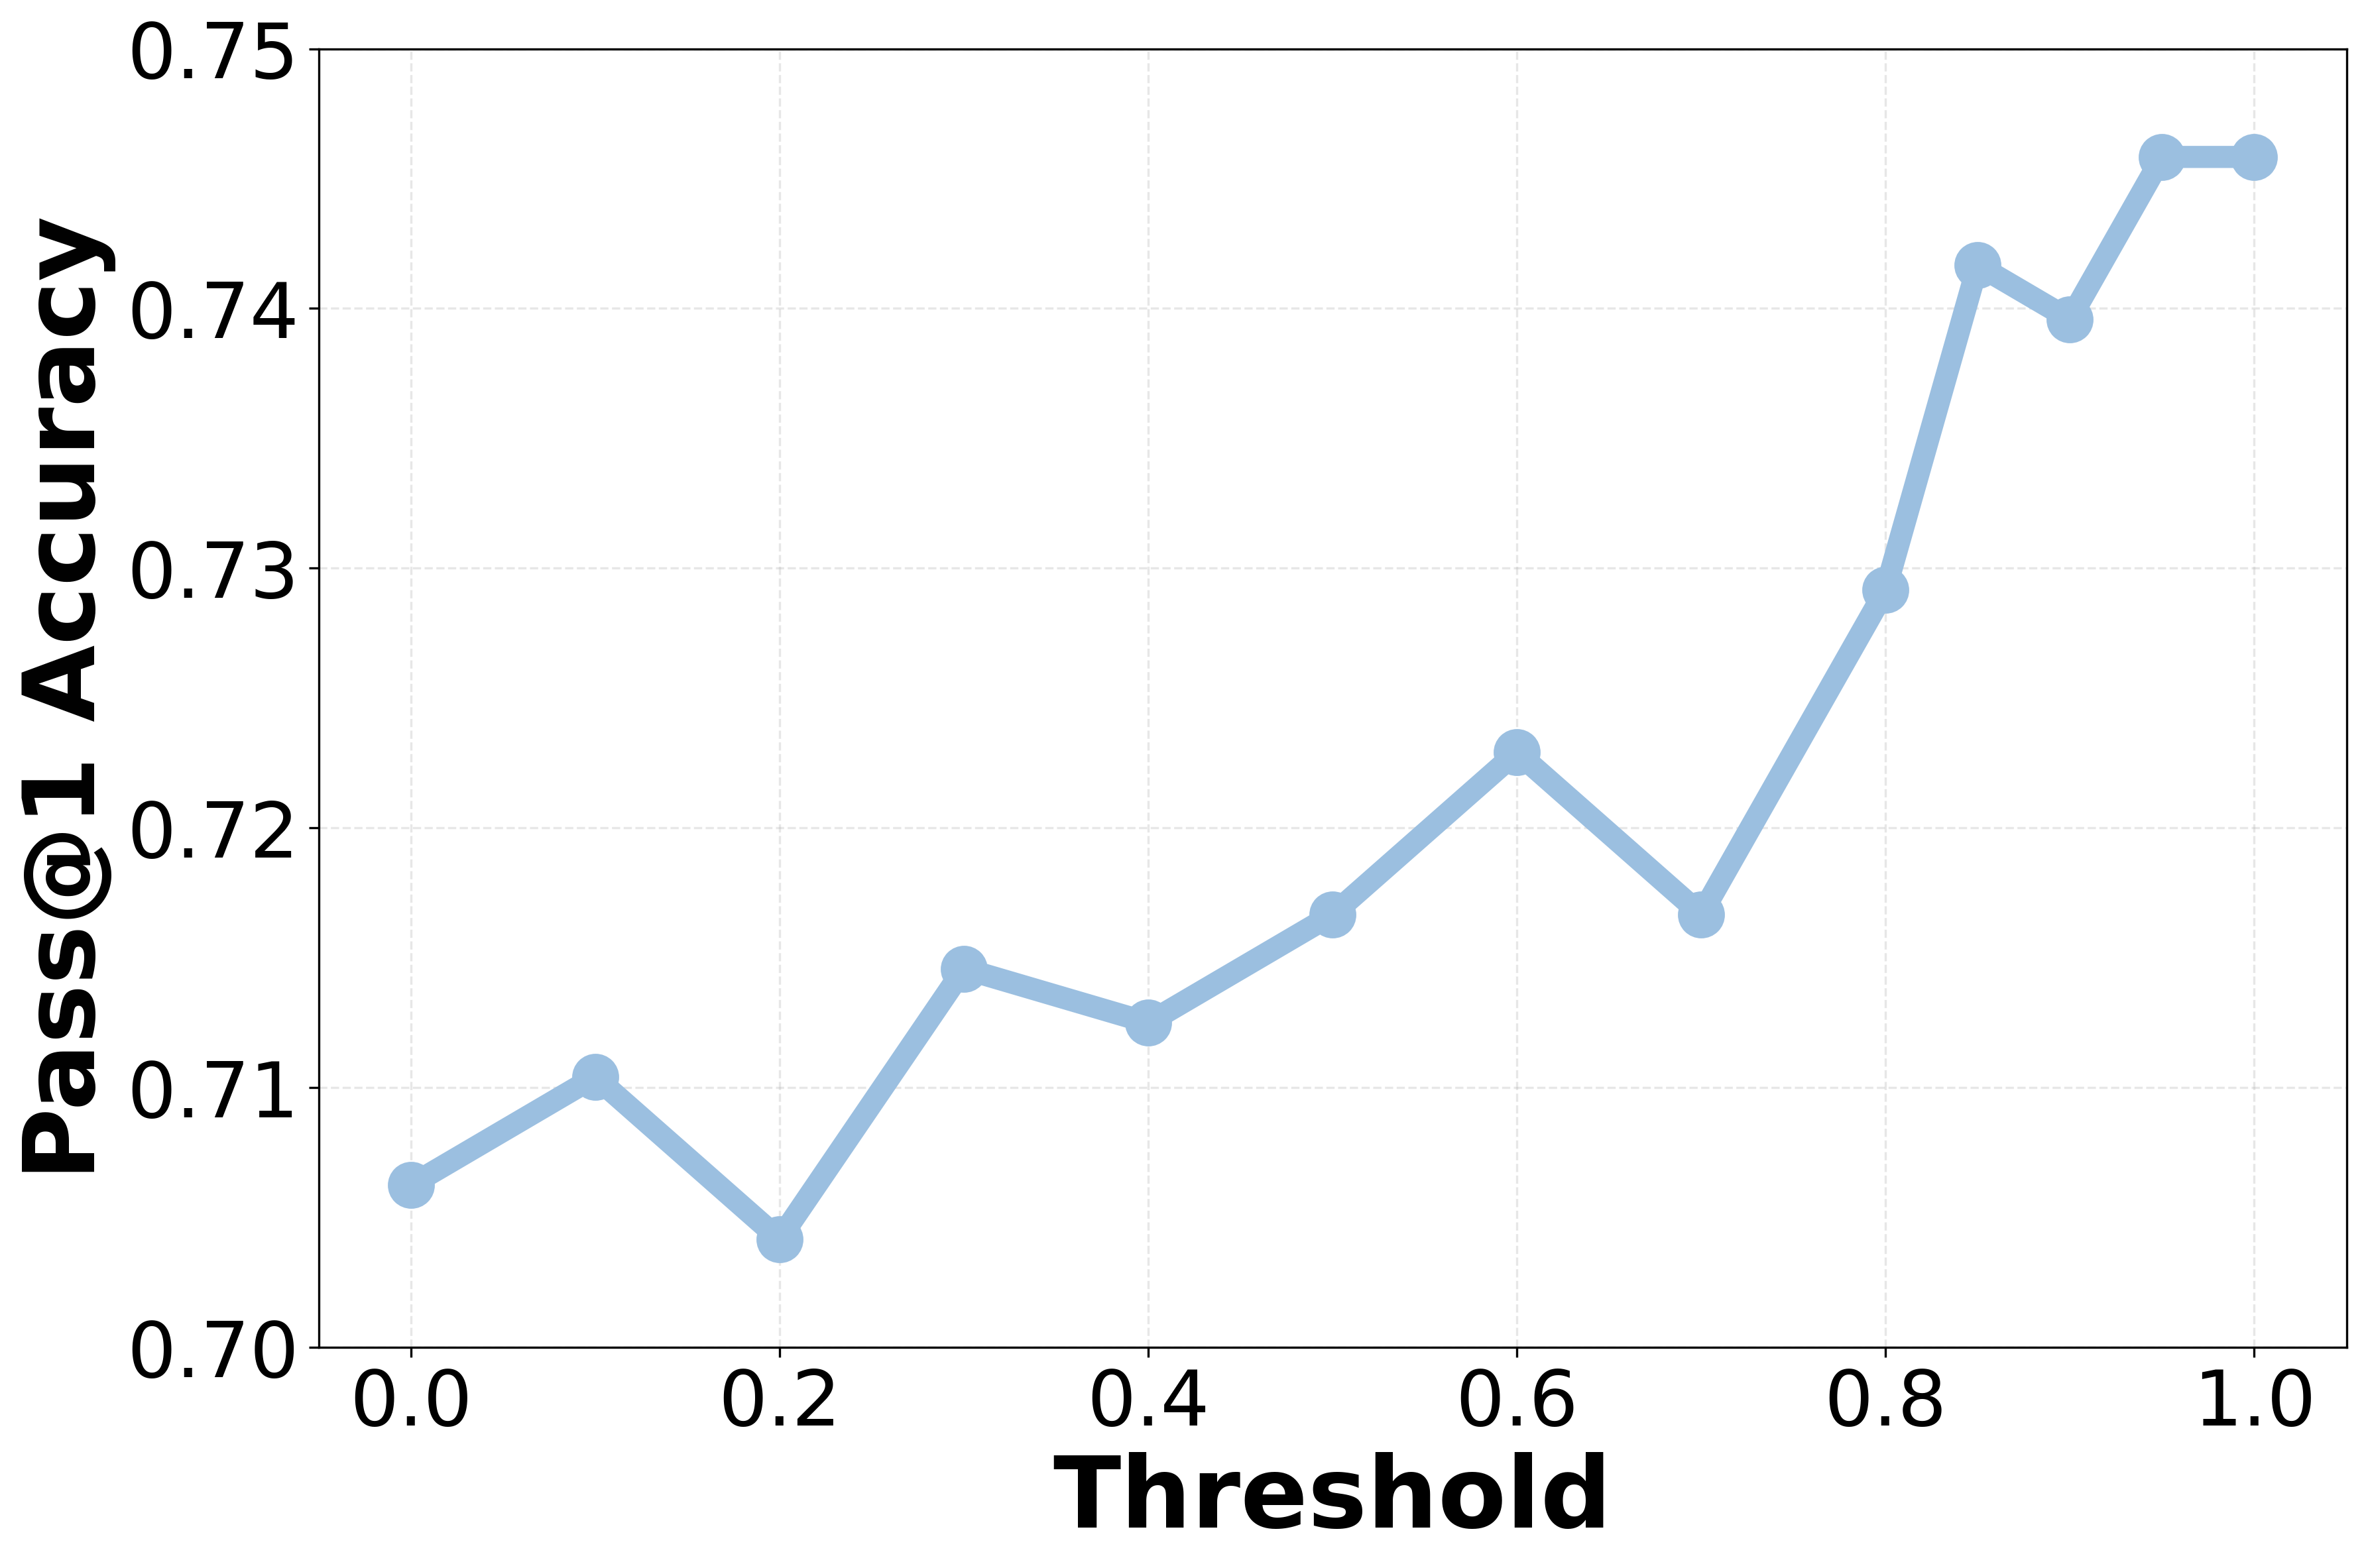
The image presents a line chart illustrating the relationship between a "Threshold" value (on the x-axis) and "Pass@1 Accuracy" (on the y-axis). The chart shows how the accuracy changes as the threshold is varied from 0.0 to 1.0.
### Components/Axes
* **X-axis:** Labeled "Threshold", ranging from 0.0 to 1.0 with increments of 0.2.
* **Y-axis:** Labeled "Pass@1 Accuracy", ranging from 0.70 to 0.75 with increments of 0.01.
* **Data Series:** A single line representing the Pass@1 Accuracy as a function of the Threshold. The line is light blue.
* **Grid:** A light gray grid is present in the background to aid in reading values.
### Detailed Analysis
The line begins at approximately (0.0, 0.71), initially decreasing to a minimum of approximately (0.2, 0.705). It then increases to around (0.4, 0.717), continues to rise to approximately (0.6, 0.723), dips to around (0.7, 0.718), and then exhibits a significant upward trend, reaching approximately (0.8, 0.732). The line continues to increase, reaching a peak of approximately (1.0, 0.747).
Here's a more detailed breakdown of data points:
* (0.0, 0.712)
* (0.2, 0.706)
* (0.4, 0.717)
* (0.6, 0.723)
* (0.7, 0.718)
* (0.8, 0.732)
* (0.9, 0.743)
* (1.0, 0.747)
The trend is generally upward, with some fluctuations. The most significant increase in accuracy occurs between Threshold values of 0.7 and 1.0.
### Key Observations
* The accuracy is relatively stable between 0.70 and 0.72 for thresholds between 0.0 and 0.7.
* There is a noticeable improvement in accuracy as the threshold approaches 1.0.
* The dip at around a threshold of 0.7 is a minor anomaly, but it doesn't significantly alter the overall upward trend.
### Interpretation
The chart suggests that increasing the threshold generally leads to higher Pass@1 accuracy, at least up to a threshold of 1.0. This implies that a more stringent criterion (higher threshold) for passing results in more accurate predictions or selections. The initial slight decrease in accuracy at a low threshold could be due to noise or less reliable data points being included when the threshold is very low. The substantial increase in accuracy at higher thresholds indicates that the system is better at identifying correct results when a higher level of confidence is required. This could be related to a filtering process where only high-confidence predictions are considered "passes". The Pass@1 metric likely refers to the proportion of times the correct answer is ranked first in a list of predictions.