## Line Graph: Pass@1 Accuracy vs. Threshold
### Overview
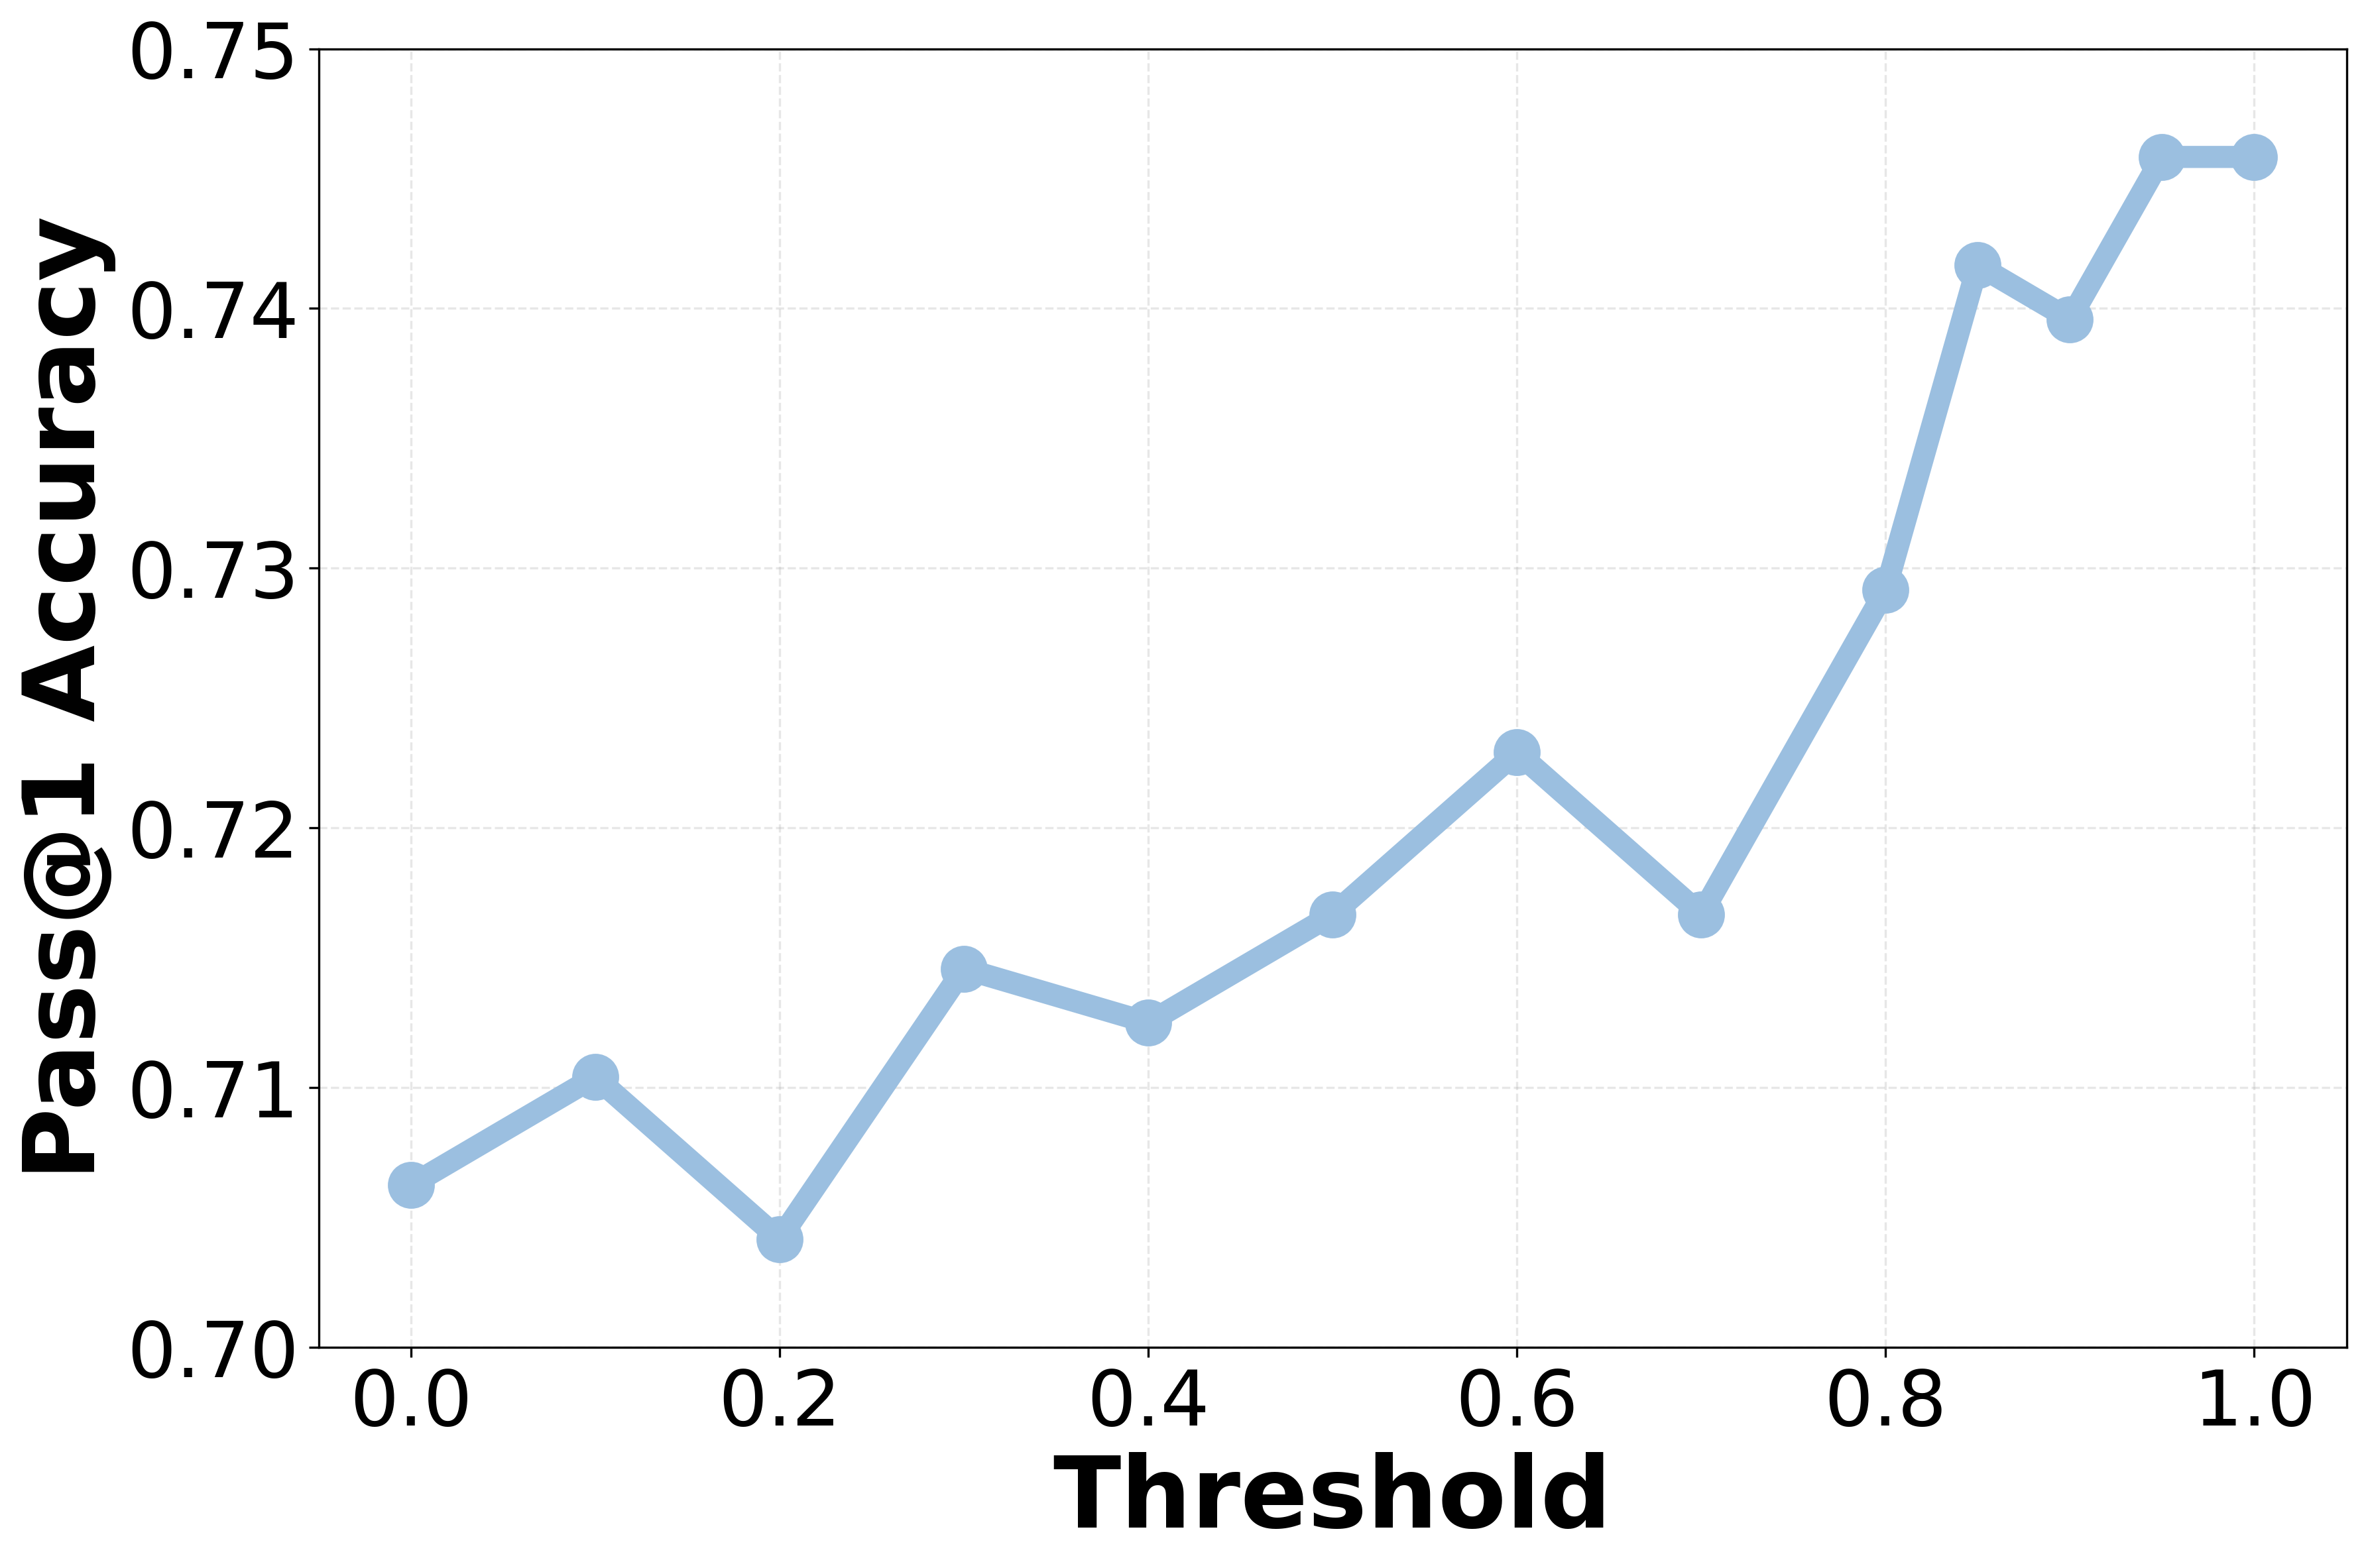
The image depicts a line graph illustrating the relationship between a "Threshold" (x-axis) and "Pass@1 Accuracy" (y-axis). The blue line shows fluctuations in accuracy across threshold values from 0.0 to 1.0, with an overall upward trend toward higher thresholds.
### Components/Axes
- **X-axis (Threshold)**: Labeled "Threshold," scaled from 0.0 to 1.0 in increments of 0.1.
- **Y-axis (Pass@1 Accuracy)**: Labeled "Pass@1 Accuracy," scaled from 0.70 to 0.75 in increments of 0.01.
- **Legend**: No explicit legend is visible in the image. The blue line is assumed to represent "Pass@1 Accuracy" based on axis labels and color coding.
- **Grid**: A light gray grid overlays the plot for reference.
### Detailed Analysis
- **Data Points**:
- (0.0, ~0.705)
- (0.1, ~0.710)
- (0.2, ~0.703)
- (0.3, ~0.714)
- (0.4, ~0.712)
- (0.5, ~0.716)
- (0.6, ~0.722)
- (0.7, ~0.716)
- (0.8, ~0.729)
- (0.9, ~0.740)
- (0.95, ~0.739)
- (1.0, ~0.745)
- **Line Behavior**: The blue line exhibits a jagged upward trend, with notable dips at thresholds 0.2, 0.4, 0.7, and 0.95. The steepest increase occurs between thresholds 0.8 and 1.0.
### Key Observations
1. **Initial Fluctuations**: The line starts at ~0.705, rises to 0.710 at 0.1, then dips to 0.703 at 0.2, suggesting sensitivity to low thresholds.
2. **Mid-Range Stability**: Between thresholds 0.3 and 0.7, accuracy stabilizes between ~0.712 and 0.722, with minor oscillations.
3. **Final Surge**: A sharp increase from 0.729 (threshold 0.8) to 0.745 (threshold 1.0) dominates the latter half, with a brief dip at 0.95 (~0.739).
4. **Peak Accuracy**: The highest accuracy (~0.745) is achieved at the maximum threshold (1.0).
### Interpretation
The data suggests that increasing the threshold generally improves Pass@1 Accuracy, though with notable variability. The peak at threshold 1.0 indicates optimal performance at the highest setting, but the dip at 0.95 raises questions about potential overfitting or noise in the data near the upper threshold range. The fluctuations at lower thresholds may reflect class imbalance or model instability in early decision boundaries. The overall trend implies that higher thresholds prioritize precision over recall, aligning with typical trade-offs in classification models.