## Line Chart: Probability Distribution P(q) at T = 1.95, Instance 1
### Overview
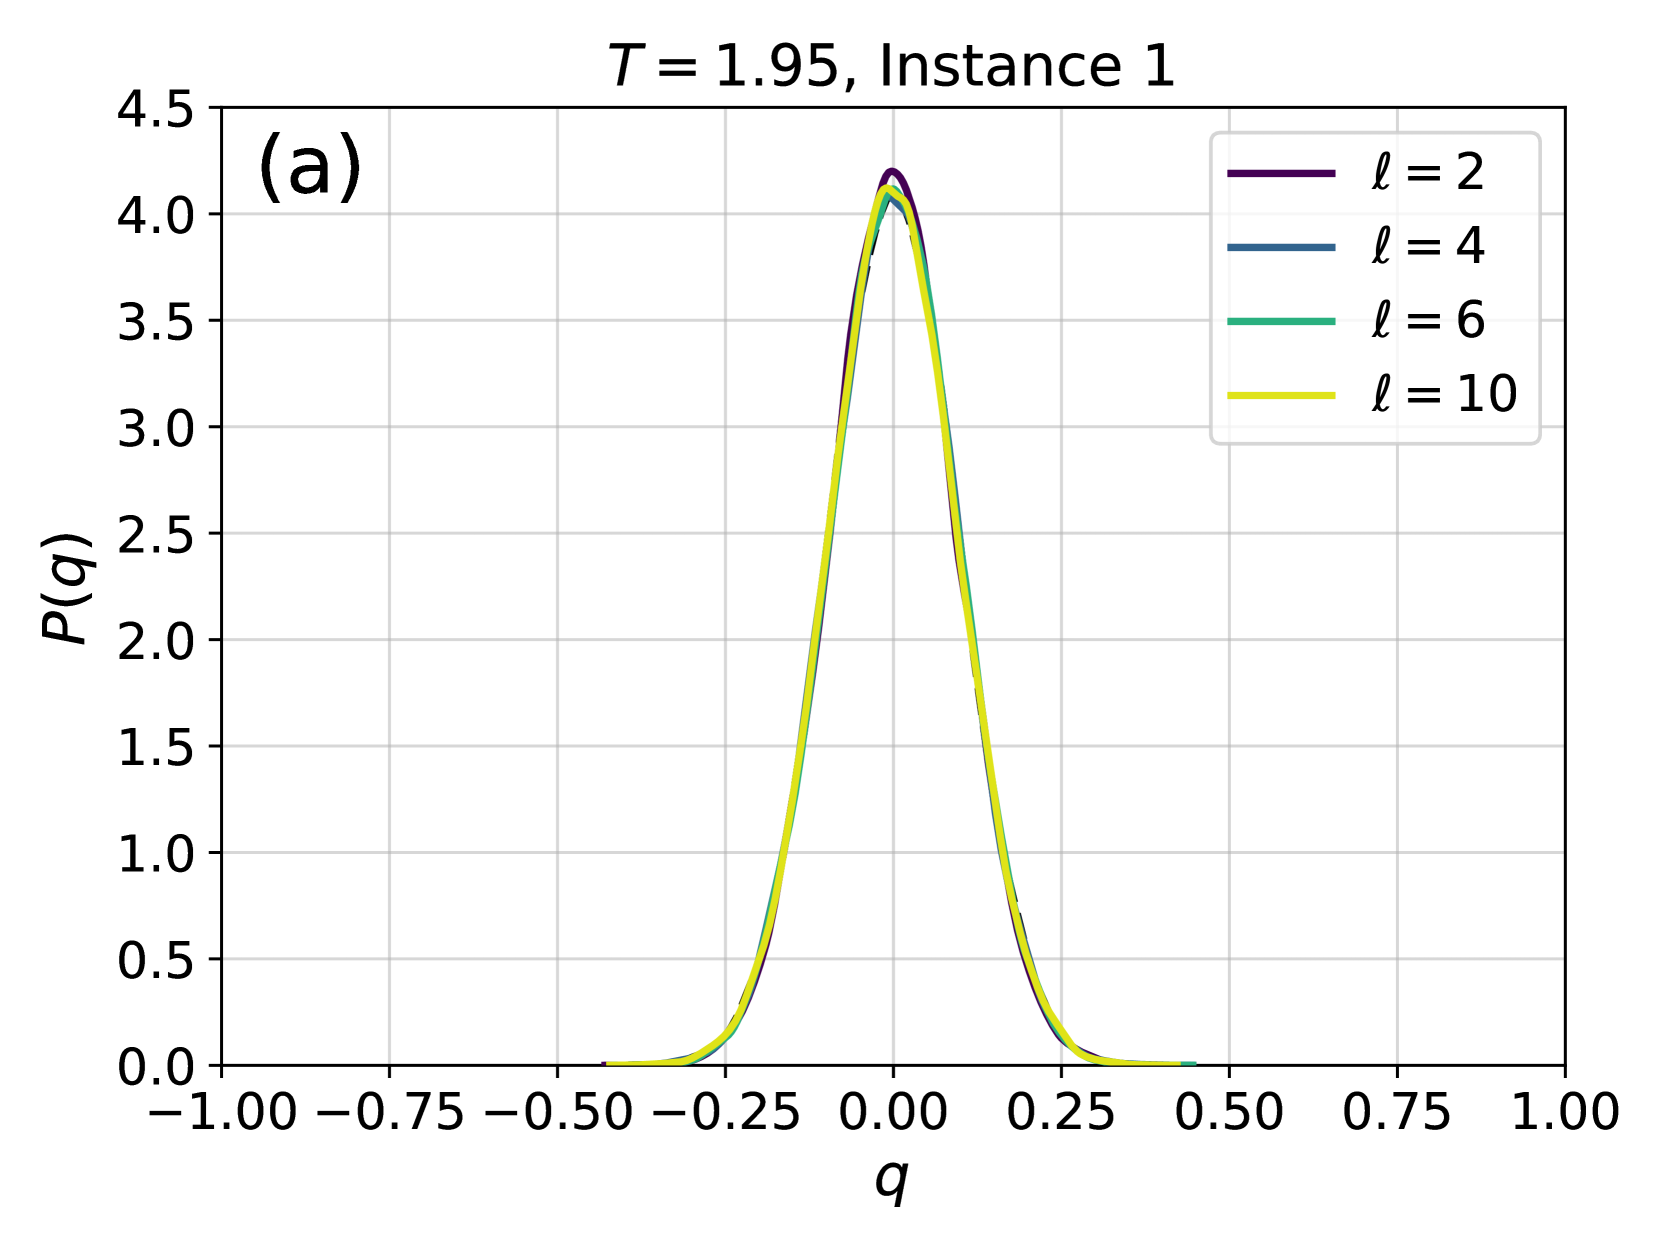
The chart displays four probability distributions P(q) as functions of q, plotted for different values of ℓ (2, 4, 6, 10). All distributions peak near q = 0, with slight variations in peak position and height. The legend is positioned in the top-right corner, and the x-axis spans from -1.00 to 1.00, while the y-axis ranges from 0 to 4.5.
### Components/Axes
- **Title**: "T = 1.95, Instance 1" (top-center).
- **Y-axis**: Labeled "P(q)" with values from 0.0 to 4.5 in increments of 0.5.
- **X-axis**: Labeled "q" with values from -1.00 to 1.00 in increments of 0.25.
- **Legend**: Located in the top-right corner, with four entries:
- Purple line: ℓ = 2
- Blue line: ℓ = 4
- Teal line: ℓ = 6
- Yellow line: ℓ = 10
### Detailed Analysis
- **ℓ = 2 (Purple)**: Peaks at approximately P(q) = 4.2 near q = 0.0. The curve is symmetric and narrow.
- **ℓ = 4 (Blue)**: Peaks at ~4.1 near q = 0.0. Slightly broader than ℓ = 2.
- **ℓ = 6 (Teal)**: Peaks at ~4.0 near q = 0.0. Broader than ℓ = 4.
- **ℓ = 10 (Yellow)**: Peaks at ~3.9 near q = 0.1 (slightly shifted right). Broader than ℓ = 6.
### Key Observations
1. All distributions are unimodal and symmetric around q = 0, except ℓ = 10, which shifts slightly to the right.
2. Peak heights decrease as ℓ increases (4.2 → 4.1 → 4.0 → 3.9).
3. The width of the distributions increases with ℓ, indicating greater dispersion for higher ℓ values.
4. The ℓ = 10 curve (yellow) is visually distinct due to its rightward shift and lower peak.
### Interpretation
The chart suggests that the probability distribution P(q) depends on the parameter ℓ. The peak shift for ℓ = 10 implies a dependency on ℓ, potentially reflecting a phase transition or critical behavior in the system. The decreasing peak heights and increasing widths with higher ℓ may indicate a trade-off between concentration and dispersion in the distribution. The closeness of the curves for ℓ = 2, 4, and 6 suggests similar underlying dynamics, while ℓ = 10 introduces a notable deviation, possibly signaling a critical threshold or anomaly in the system's behavior.