## Line Graphs: Performance Comparison Across Datasets
### Overview
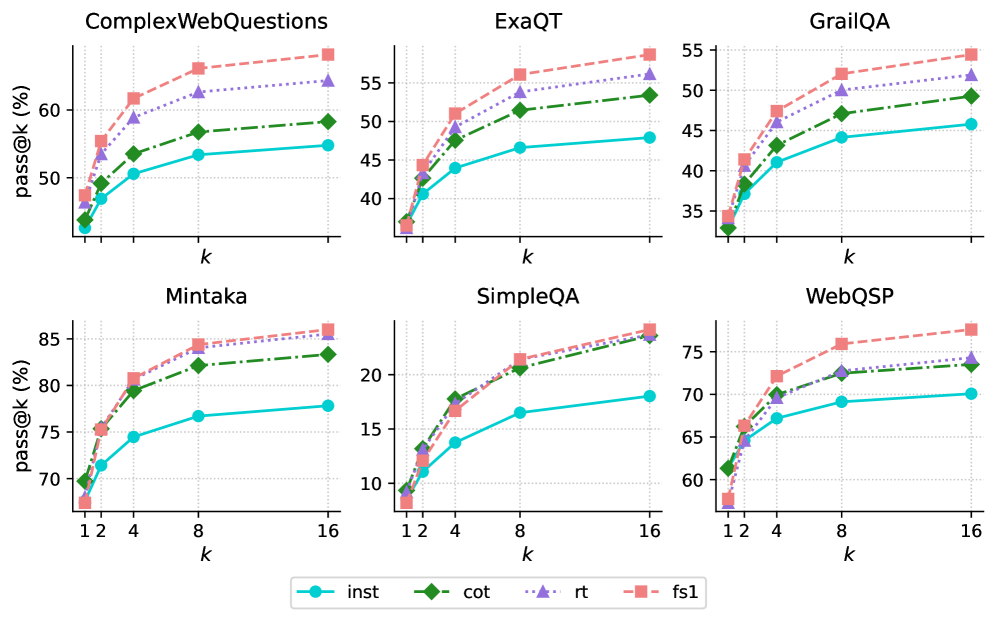
The image contains six line graphs arranged in two rows and three columns, comparing the performance of four methods (`inst`, `cot`, `rt`, `fs1`) across six datasets (`ComplexWebQuestions`, `ExaQT`, `GrailQA`, `Mintaka`, `SimpleQA`, `WebQSP`). Each graph plots `pass@k (%)` on the y-axis against `k` (1–16) on the x-axis. The legend at the bottom center identifies the methods with distinct colors and markers: `inst` (blue line), `cot` (green dashed line), `rt` (purple dotted line), and `fs1` (red square markers).
---
### Components/Axes
- **Y-axis**: `pass@k (%)` (performance metric, ranging from ~35% to 85% depending on the dataset).
- **X-axis**: `k` (integer values from 1 to 16, likely representing a parameter like sample size or iteration count).
- **Legend**: Located at the bottom center, with four entries:
- `inst`: Solid blue line.
- `cot`: Green dashed line.
- `rt`: Purple dotted line.
- `fs1`: Red square markers.
- **Graph Titles**: Each subplot is labeled with a dataset name (e.g., `ComplexWebQuestions`, `Mintaka`).
---
### Detailed Analysis
#### ComplexWebQuestions
- **Trends**: All methods show upward trends. `fs1` (red) starts highest (~55% at k=1) and increases steeply to ~68% at k=16. `inst` (blue) starts lowest (~45% at k=1) and rises to ~53% at k=16. `cot` (green) and `rt` (purple) follow intermediate trajectories (~50–63%).
- **Key Data Points**:
- k=1: `fs1` ~55%, `inst` ~45%, `cot` ~48%, `rt` ~52%.
- k=16: `fs1` ~68%, `inst` ~53%, `cot` ~58%, `rt` ~63%.
#### ExaQT
- **Trends**: Similar upward trajectories. `fs1` leads (~45% at k=1 → ~55% at k=16). `inst` (~38% → ~47%), `cot` (~42% → ~52%), and `rt` (~40% → ~53%) lag slightly behind.
- **Key Data Points**:
- k=1: `fs1` ~45%, `inst` ~38%, `cot` ~42%, `rt` ~40%.
- k=16: `fs1` ~55%, `inst` ~47%, `cot` ~52%, `rt` ~53%.
#### GrailQA
- **Trends**: `fs1` dominates (~35% → ~55%). `inst` (~30% → ~45%), `cot` (~32% → ~48%), and `rt` (~34% → ~51%) show moderate gains.
- **Key Data Points**:
- k=1: `fs1` ~35%, `inst` ~30%, `cot` ~32%, `rt` ~34%.
- k=16: `fs1` ~55%, `inst` ~45%, `cot` ~48%, `rt` ~51%.
#### Mintaka
- **Trends**: Highest performance overall. `fs1` (~70% → ~85%), `inst` (~65% → ~78%), `cot` (~72% → ~82%), and `rt` (~70% → ~83%) all improve significantly.
- **Key Data Points**:
- k=1: `fs1` ~70%, `inst` ~65%, `cot` ~72%, `rt` ~70%.
- k=16: `fs1` ~85%, `inst` ~78%, `cot` ~82%, `rt` ~83%.
#### SimpleQA
- **Trends**: `fs1` (~10% → ~22%), `inst` (~12% → ~18%), `cot` (~15% → ~21%), and `rt` (~13% → ~20%) show steep gains.
- **Key Data Points**:
- k=1: `fs1` ~10%, `inst` ~12%, `cot` ~15%, `rt` ~13%.
- k=16: `fs1` ~22%, `inst` ~18%, `cot` ~21%, `rt` ~20%.
#### WebQSP
- **Trends**: `fs1` (~60% → ~78%), `inst` (~55% → ~70%), `cot` (~62% → ~74%), and `rt` (~60% → ~75%) improve consistently.
- **Key Data Points**:
- k=1: `fs1` ~60%, `inst` ~55%, `cot` ~62%, `rt` ~60%.
- k=16: `fs1` ~78%, `inst` ~70%, `cot` ~74%, `rt` ~75%.
---
### Key Observations
1. **Consistent Ranking**: `fs1` (red) consistently outperforms other methods across all datasets, followed by `cot` (green), `rt` (purple), and `inst` (blue).
2. **Dataset Variability**: Performance levels vary by dataset (e.g., `Mintaka` has the highest baseline performance, while `SimpleQA` starts lowest).
3. **Scaling with k**: All methods improve as `k` increases, suggesting `k` represents a parameter (e.g., sample size) that enhances performance when increased.
4. **Convergence**: In some datasets (e.g., `Mintaka`), the gap between methods narrows at higher `k` values.
---
### Interpretation
The data demonstrates that `fs1` is the most effective method across all datasets, likely due to its architectural or algorithmic advantages. The consistent upward trend for all methods with increasing `k` implies that larger values of `k` (e.g., more training data or iterations) improve performance universally. Dataset-specific differences (e.g., `Mintaka` vs. `SimpleQA`) may reflect variations in complexity or task difficulty. The legend’s spatial placement (bottom center) ensures clarity, while the uniform axis scaling across subplots allows direct comparison. No outliers or anomalies are observed, reinforcing the reliability of the trends.