## Line Charts: Pass@k Performance on Question Answering Datasets
### Overview
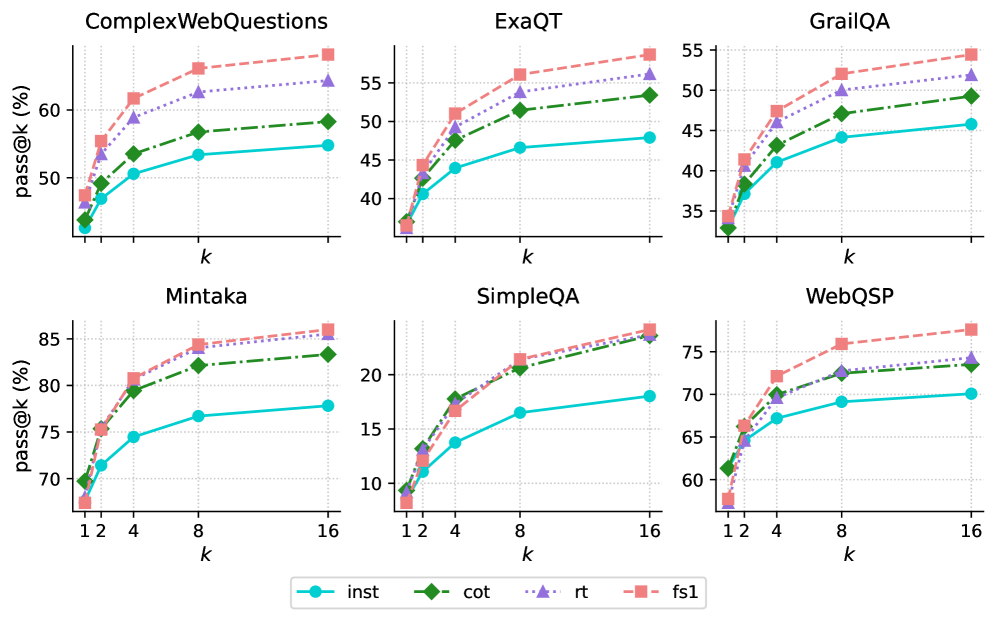
The image presents a series of line charts comparing the performance of four different methods (inst, cot, rt, fs1) on six question answering datasets (ComplexWebQuestions, ExaQT, GrailQA, Mintaka, SimpleQA, WebQSP). The charts display the "pass@k" metric (percentage of questions answered correctly within the top k predictions) as a function of k.
### Components/Axes
* **Titles (Top Row, Left to Right):** ComplexWebQuestions, ExaQT, GrailQA
* **Titles (Bottom Row, Left to Right):** Mintaka, SimpleQA, WebQSP
* **Y-axis Label (All Charts):** pass@k (%)
* **X-axis Label (All Charts):** k
* **X-axis Scale (All Charts):** 1, 2, 4, 8, 16
* **Y-axis Scale (Varies by Chart):**
* ComplexWebQuestions: 40 to 60
* ExaQT: 35 to 55
* GrailQA: 35 to 55
* Mintaka: 70 to 85
* SimpleQA: 10 to 25
* WebQSP: 60 to 75
* **Legend (Bottom Center):**
* `inst`: Cyan line with circle markers
* `cot`: Green dash-dot line with diamond markers
* `rt`: Purple dotted line with triangle markers
* `fs1`: Pink dashed line with square markers
### Detailed Analysis
**ComplexWebQuestions**
* `inst` (Cyan): Starts at approximately 43%, increases to about 53% at k=16.
* `cot` (Green): Starts at approximately 44%, increases to about 54% at k=16.
* `rt` (Purple): Starts at approximately 47%, increases to about 58% at k=16.
* `fs1` (Pink): Starts at approximately 48%, increases to about 62% at k=16.
**ExaQT**
* `inst` (Cyan): Starts at approximately 37%, increases to about 48% at k=16.
* `cot` (Green): Starts at approximately 37%, increases to about 53% at k=16.
* `rt` (Purple): Starts at approximately 41%, increases to about 54% at k=16.
* `fs1` (Pink): Starts at approximately 42%, increases to about 57% at k=16.
**GrailQA**
* `inst` (Cyan): Starts at approximately 35%, increases to about 47% at k=16.
* `cot` (Green): Starts at approximately 35%, increases to about 52% at k=16.
* `rt` (Purple): Starts at approximately 40%, increases to about 53% at k=16.
* `fs1` (Pink): Starts at approximately 41%, increases to about 55% at k=16.
**Mintaka**
* `inst` (Cyan): Starts at approximately 69%, increases to about 78% at k=16.
* `cot` (Green): Starts at approximately 70%, increases to about 83% at k=16.
* `rt` (Purple): Starts at approximately 75%, increases to about 84% at k=16.
* `fs1` (Pink): Starts at approximately 68%, increases to about 86% at k=16.
**SimpleQA**
* `inst` (Cyan): Starts at approximately 9%, increases to about 18% at k=16.
* `cot` (Green): Starts at approximately 9%, increases to about 22% at k=16.
* `rt` (Purple): Starts at approximately 12%, increases to about 23% at k=16.
* `fs1` (Pink): Starts at approximately 9%, increases to about 24% at k=16.
**WebQSP**
* `inst` (Cyan): Starts at approximately 61%, increases to about 70% at k=16.
* `cot` (Green): Starts at approximately 61%, increases to about 74% at k=16.
* `rt` (Purple): Starts at approximately 66%, increases to about 73% at k=16.
* `fs1` (Pink): Starts at approximately 60%, increases to about 78% at k=16.
### Key Observations
* **General Trend:** All methods show an increase in `pass@k` as `k` increases across all datasets. The rate of increase diminishes as k increases.
* **Relative Performance:** The `fs1` method generally achieves the highest `pass@k` values across most datasets, followed by `rt` and `cot`. The `inst` method typically has the lowest `pass@k` values.
* **Dataset Difficulty:** The `pass@k` values vary significantly across datasets, indicating varying levels of difficulty. SimpleQA has the lowest overall performance, while Mintaka has the highest.
* **Performance Saturation:** The performance gain diminishes as k increases, suggesting that after a certain point, increasing k provides diminishing returns.
### Interpretation
The data suggests that the `fs1` method is generally the most effective among the four methods evaluated for question answering across these datasets. The performance differences between the methods highlight the impact of different approaches on question answering accuracy. The varying performance across datasets indicates that the difficulty of question answering is highly dependent on the specific dataset characteristics. The diminishing returns observed as k increases suggest that optimizing the ranking of the top few predictions is crucial for maximizing performance.