\n
## Charts: Pass@k Performance Across Datasets
### Overview
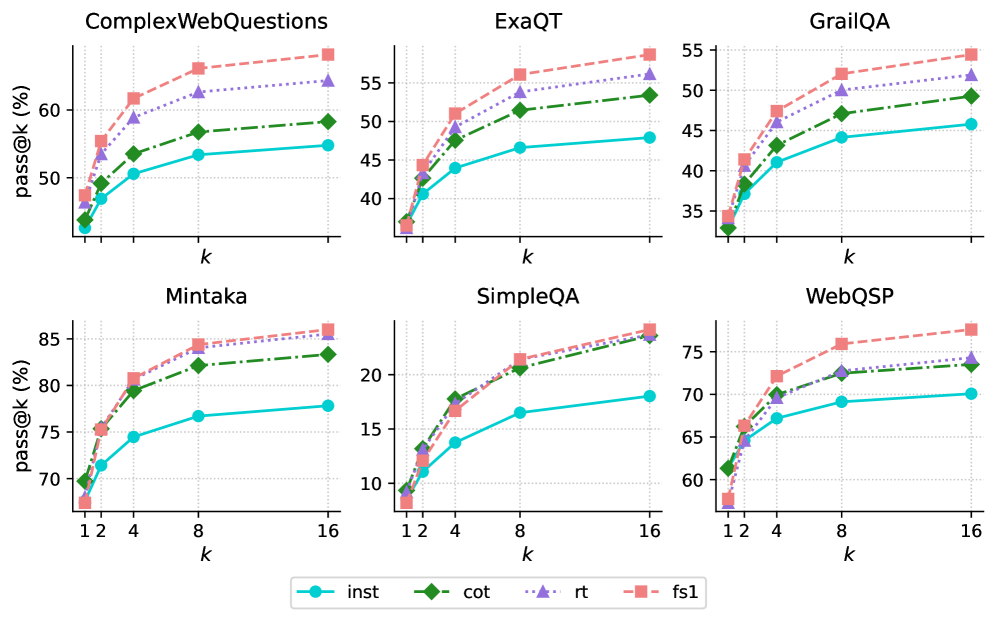
The image presents six separate line charts, each displaying the pass@k performance (in percentage) for different models (inst, cot, rt, fs1) across six different question answering datasets: ComplexWebQuestions, ExaQT, GrailQA, Mintaka, SimpleQA, and WebQSP. The x-axis represents 'k', likely indicating the number of retrieved answers considered, and the y-axis represents the pass@k score (percentage).
### Components/Axes
* **X-axis Label (all charts):** k
* **Y-axis Label (all charts):** pass@k (%)
* **Legend (bottom-center):**
* inst (cyan solid line)
* cot (green solid line with triangle markers)
* rt (red dotted line)
* fs1 (red dashed line with square markers)
* **Chart Titles (top-center of each chart):**
* ComplexWebQuestions
* ExaQT
* GrailQA
* Mintaka
* SimpleQA
* WebQSP
* **X-axis Scale:** Varies per chart.
* ComplexWebQuestions: 1, 2, 4, 8, 16
* ExaQT: 1, 2, 4, 8, 16
* GrailQA: 1, 2, 4, 8, 16
* Mintaka: 1, 2, 4, 8, 16
* SimpleQA: 1, 2, 4, 8, 16
* WebQSP: 1, 2, 4, 8, 16
* **Y-axis Scale:** Varies per chart, but generally ranges from approximately 30% to 85%.
### Detailed Analysis
Here's a breakdown of the data for each chart:
**1. ComplexWebQuestions:**
* **inst:** Starts at ~40%, increases to ~60% at k=16. The line slopes upward, but the increase slows down after k=8.
* **cot:** Starts at ~45%, increases to ~62% at k=16. Similar upward slope to 'inst', with a slowing increase after k=8.
* **rt:** Starts at ~50%, increases to ~62% at k=16. Relatively flat slope.
* **fs1:** Starts at ~52%, increases to ~63% at k=16. Slightly steeper slope than 'rt'.
**2. ExaQT:**
* **inst:** Starts at ~38%, increases to ~52% at k=16. Upward slope, with a more pronounced slowing after k=8.
* **cot:** Starts at ~42%, increases to ~55% at k=16. Similar trend to 'inst'.
* **rt:** Starts at ~45%, increases to ~55% at k=16. Relatively flat slope.
* **fs1:** Starts at ~48%, increases to ~56% at k=16. Slightly steeper slope than 'rt'.
**3. GrailQA:**
* **inst:** Starts at ~35%, increases to ~48% at k=16. Upward slope, slowing after k=8.
* **cot:** Starts at ~38%, increases to ~50% at k=16. Similar trend to 'inst'.
* **rt:** Starts at ~42%, increases to ~52% at k=16. Relatively flat slope.
* **fs1:** Starts at ~45%, increases to ~53% at k=16. Slightly steeper slope than 'rt'.
**4. Mintaka:**
* **inst:** Starts at ~72%, increases to ~82% at k=16. Steep upward slope, with a slight slowing after k=8.
* **cot:** Starts at ~75%, increases to ~84% at k=16. Similar trend to 'inst'.
* **rt:** Starts at ~78%, increases to ~84% at k=16. Relatively flat slope.
* **fs1:** Starts at ~80%, increases to ~85% at k=16. Slightly steeper slope than 'rt'.
**5. SimpleQA:**
* **inst:** Starts at ~8%, increases to ~20% at k=16. Steep upward slope, with a slight slowing after k=8.
* **cot:** Starts at ~10%, increases to ~22% at k=16. Similar trend to 'inst'.
* **rt:** Starts at ~12%, increases to ~22% at k=16. Relatively flat slope.
* **fs1:** Starts at ~14%, increases to ~23% at k=16. Slightly steeper slope than 'rt'.
**6. WebQSP:**
* **inst:** Starts at ~64%, increases to ~72% at k=16. Upward slope, slowing after k=8.
* **cot:** Starts at ~67%, increases to ~74% at k=16. Similar trend to 'inst'.
* **rt:** Starts at ~70%, increases to ~74% at k=16. Relatively flat slope.
* **fs1:** Starts at ~72%, increases to ~75% at k=16. Slightly steeper slope than 'rt'.
### Key Observations
* 'fs1' consistently performs better than 'rt' across all datasets.
* 'inst' and 'cot' generally show similar performance trends.
* The performance gains from increasing 'k' diminish as 'k' increases, indicating diminishing returns.
* Mintaka has the highest overall pass@k scores, while SimpleQA has the lowest.
* The relative performance of the models varies across datasets. For example, 'rt' and 'fs1' are closer in performance on GrailQA than on Mintaka.
### Interpretation
The charts demonstrate the pass@k performance of different retrieval-augmented generation models on various question answering datasets. The 'k' parameter represents the number of retrieved documents considered, and the pass@k score indicates the percentage of questions answered correctly when considering the top 'k' retrieved documents.
The consistent outperformance of 'fs1' over 'rt' suggests that the 'fs1' method is more effective at leveraging retrieved information. The similar performance of 'inst' and 'cot' indicates that the chain-of-thought prompting strategy ('cot') doesn't significantly improve performance in this setting.
The varying performance across datasets highlights the importance of dataset characteristics. Mintaka, with its high pass@k scores, likely presents questions that are easier to answer with retrieved information, while SimpleQA, with its low scores, may involve more complex reasoning or require information not readily available in the retrieved documents.
The diminishing returns observed as 'k' increases suggest that there's a limit to the benefit of considering more retrieved documents. Beyond a certain point, the additional documents may introduce noise or irrelevant information, hindering performance. This suggests an optimal 'k' value exists for each dataset and model combination.