## Diagram: Signal ProcessingPipeline with Vector Quantization
### Overview
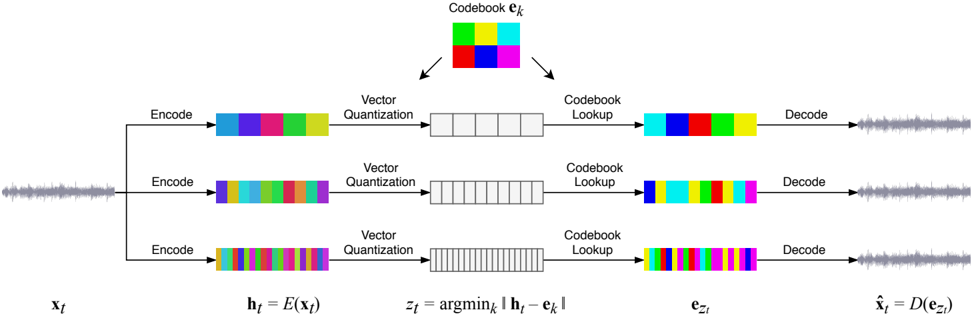
The diagram illustrates a multi-stage signal processing pipeline involving encoding, vector quantization, codebook lookup, and decoding. It includes mathematical expressions for quantization and reconstruction, with a visual representation of a codebook and signal transformations.
### Components/Axes
1. **Input Signal**: Labeled `x_t` (time-series signal) on the far left.
2. **Encoding Stage**: Three parallel "Encode" blocks producing vectors `h_t = E(x_t)`.
3. **Vector Quantization**:
- Mathematical expression: `z_t = argmin_k ||h_t - e_k||` (finds closest codebook entry).
- Visualized as horizontal bars with color-coded segments.
4. **Codebook**:
- Labeled `Codebook e_k` at the top.
- 4x4 grid of colored squares (green, yellow, cyan, red, blue, magenta).
5. **Codebook Lookup**:
- Outputs `e_z_t` (selected codebook vector).
- Visualized as horizontal bars matching codebook colors.
6. **Decoding Stage**:
- Mathematical expression: `x̂_t = D(e_z_t)` (reconstructs signal).
- Output signal `x̂_t` on the far right.
7. **Flow Direction**: Arrows indicate left-to-right processing sequence.
### Detailed Analysis
- **Encoding**: Input `x_t` is transformed into latent vectors `h_t` via three parallel encoding paths (distinct color patterns).
- **Quantization**: Each `h_t` is mapped to the nearest codebook entry `e_k` using L2 distance (`argmin_k`).
- **Codebook Structure**: 16 discrete vectors (`e_k`) represented as colored squares. Colors repeat across rows but with varying patterns.
- **Reconstruction**: Selected codebook vector `e_z_t` is decoded to approximate the original signal `x̂_t`.
### Key Observations
1. **Parallel Encoding Paths**: Three distinct encoding methods (color-coded) process `x_t` simultaneously.
2. **Codebook Reuse**: The same 4x4 codebook is used for all quantization steps, suggesting shared dictionary learning.
3. **Reconstruction Fidelity**: Output `x̂_t` retains temporal structure but with reduced granularity compared to `x_t`.
4. **Mathematical Constraints**: Quantization is defined as nearest-neighbor search in codebook space.
### Interpretation
This diagram represents a **vector quantization (VQ)** process, commonly used in:
- **Signal Compression**: Reducing data dimensionality while preserving essential features.
- **Neural Networks**: Discrete codebook-based models (e.g., VQ-VAE).
- **Speech/Image Processing**: Efficient representation of continuous signals.
The codebook `e_k` acts as a learned dictionary of basis vectors. The `argmin_k` operation enforces hard quantization (no interpolation), while `D(e_z_t)` implies a deterministic decoding function. The parallel encoding paths suggest multi-modal feature extraction before quantization. The diagram emphasizes the trade-off between reconstruction accuracy (`x̂_t` vs. `x_t`) and computational efficiency via codebook reuse.