## Log-Log Plot: Number of MC Steps vs. Dimension
### Overview
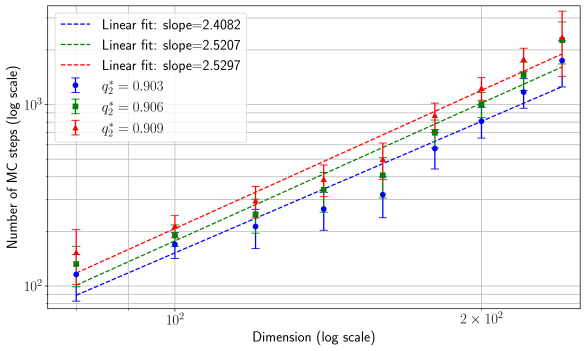
The image is a log-log plot showing the relationship between the number of Monte Carlo (MC) steps and the dimension, for three different values of a parameter denoted as q*_2. The plot includes error bars for the data points and linear fits for each q*_2 value.
### Components/Axes
* **X-axis:** Dimension (log scale). The axis ranges from approximately 50 to 250, with major ticks at 10^2 and 2 x 10^2.
* **Y-axis:** Number of MC steps (log scale). The axis ranges from approximately 100 to 2000, with major ticks at 10^2 and 10^3.
* **Legend (top-left):**
* Blue dashed line: Linear fit: slope=2.4082
* Green dashed line: Linear fit: slope=2.5207
* Red dashed line: Linear fit: slope=2.5297
* Blue circle: q*_2 = 0.903
* Green square: q*_2 = 0.906
* Red triangle: q*_2 = 0.909
### Detailed Analysis
* **Data Points and Error Bars:** The plot shows data points for three different values of q*_2 (0.903, 0.906, and 0.909), each with associated error bars. The error bars represent the uncertainty in the number of MC steps.
* **Linear Fits:** Each set of data points is fitted with a linear function, represented by dashed lines. The slopes of these lines are provided in the legend.
* **q*_2 = 0.903 (Blue Circles):**
* Trend: The number of MC steps increases with dimension.
* Approximate data points: (50, 120), (75, 150), (100, 220), (150, 350), (200, 550), (250, 800)
* **q*_2 = 0.906 (Green Squares):**
* Trend: The number of MC steps increases with dimension.
* Approximate data points: (50, 140), (75, 200), (100, 300), (150, 500), (200, 800), (250, 1200)
* **q*_2 = 0.909 (Red Triangles):**
* Trend: The number of MC steps increases with dimension.
* Approximate data points: (50, 160), (75, 250), (100, 400), (150, 650), (200, 1000), (250, 1500)
### Key Observations
* All three data series show a positive correlation between dimension and the number of MC steps.
* The slopes of the linear fits are similar for the green and red data series (approximately 2.52), while the blue data series has a slightly lower slope (2.4082).
* As q*_2 increases, the number of MC steps also tends to increase for a given dimension.
* The error bars appear to increase with the number of MC steps.
### Interpretation
The plot suggests that the number of Monte Carlo steps required for a simulation increases with the dimension of the system. The parameter q*_2 appears to influence the magnitude of this increase, with higher values of q*_2 leading to a greater number of MC steps. The linear fits on the log-log scale indicate a power-law relationship between the number of MC steps and the dimension. The slopes of the linear fits represent the exponents of these power laws. The increasing error bars with the number of MC steps might indicate that the uncertainty in the simulation results grows as the simulation becomes more complex (i.e., requires more steps).