## Chart: Monte Carlo Steps vs. Dimension
### Overview
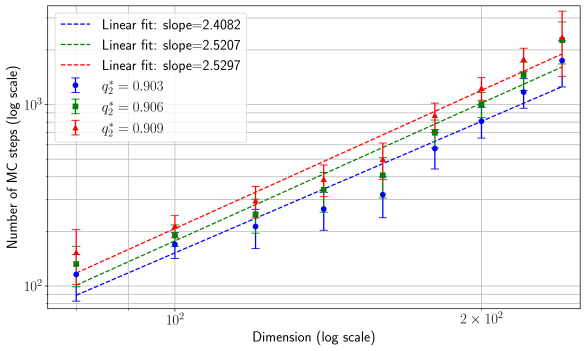
The image presents a chart illustrating the relationship between the number of Monte Carlo (MC) steps required and the dimension of a problem. Three different lines represent different values of q², with error bars indicating uncertainty in the number of MC steps. Both axes are on a logarithmic scale. The chart appears to demonstrate a scaling relationship between these two variables.
### Components/Axes
* **X-axis:** Dimension (log scale). Marked with values approximately 10¹, 10², and 2 x 10².
* **Y-axis:** Number of MC steps (log scale). Marked with values approximately 10¹, 10³, and 10⁴.
* **Lines:** Three lines representing different q² values.
* Blue dashed line: Linear fit, slope = 2.4082, q² = 0.903
* Green dashed-dotted line: Linear fit, slope = 2.5207, q² = 0.906
* Red dashed line: Linear fit, slope = 2.5297, q² = 0.909
* **Legend:** Located in the top-left corner, detailing the line styles, slopes, and q² values.
* **Error Bars:** Vertical lines extending above and below each data point, representing the uncertainty in the number of MC steps.
### Detailed Analysis
The chart shows three lines, each representing a linear fit to data points. All three lines exhibit a positive slope, indicating that as the dimension increases, the number of MC steps required also increases. The slopes are relatively similar, ranging from approximately 2.4082 to 2.5297.
Let's analyze the data points for each line, noting the approximate values based on the logarithmic scales:
**Blue Line (q² = 0.903, slope = 2.4082):**
* Dimension ≈ 10¹: Number of MC steps ≈ 20
* Dimension ≈ 10²: Number of MC steps ≈ 200
* Dimension ≈ 2 x 10²: Number of MC steps ≈ 600
**Green Line (q² = 0.906, slope = 2.5207):**
* Dimension ≈ 10¹: Number of MC steps ≈ 30
* Dimension ≈ 10²: Number of MC steps ≈ 300
* Dimension ≈ 2 x 10²: Number of MC steps ≈ 800
**Red Line (q² = 0.909, slope = 2.5297):**
* Dimension ≈ 10¹: Number of MC steps ≈ 40
* Dimension ≈ 10²: Number of MC steps ≈ 400
* Dimension ≈ 2 x 10²: Number of MC steps ≈ 1000
The error bars are relatively consistent across all dimensions for each line, indicating a similar level of uncertainty in the number of MC steps.
### Key Observations
* The number of MC steps scales approximately linearly with the dimension on a log-log plot, suggesting a power-law relationship.
* The slope of the lines increases slightly with increasing q² values.
* The lines are relatively close to each other, suggesting that the q² value has a relatively small effect on the scaling relationship.
* The error bars indicate that there is some uncertainty in the number of MC steps, but the overall trend is clear.
### Interpretation
The chart demonstrates that the computational cost of Monte Carlo simulations increases with the dimensionality of the problem. The number of MC steps required to achieve a certain level of accuracy grows approximately linearly with the dimension on a logarithmic scale, implying a power-law relationship. The slopes of the lines provide an estimate of the exponent in this power law.
The q² parameter likely represents a quality factor or a measure of the problem's complexity. The slight increase in slope with increasing q² suggests that more complex problems (higher q²) require more MC steps per dimension.
The consistent error bars indicate that the uncertainty in the number of MC steps is relatively constant across different dimensions. This suggests that the method used to estimate the number of MC steps is reliable.
The chart highlights the "curse of dimensionality" in Monte Carlo simulations, where the computational cost increases exponentially with the number of dimensions. This has significant implications for the application of Monte Carlo methods to high-dimensional problems. The data suggests that the scaling is closer to polynomial than exponential, but still represents a significant challenge.