## Line Graph: Scaling of Monte Carlo Steps with Dimension
### Overview
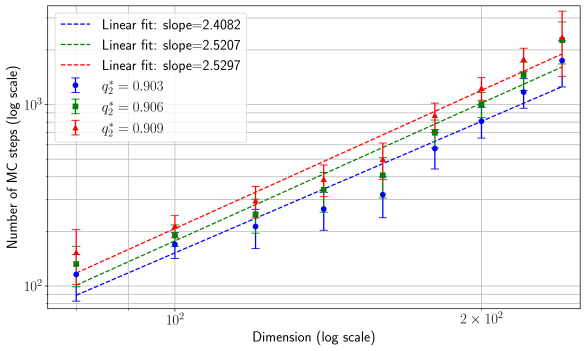
The image is a line graph depicting the relationship between computational dimension (on a logarithmic scale) and the number of Monte Carlo (MC) steps required (also on a logarithmic scale). Three distinct linear fits are plotted, each corresponding to different parameter values of *q₂* (0.903, 0.906, 0.909). The graph uses dashed lines for the linear fits and markers with error bars for data points.
---
### Components/Axes
- **X-axis**: "Dimension (log scale)" ranging from 10² to 2×10².
- **Y-axis**: "Number of MC steps (log scale)" ranging from 10² to 10³.
- **Legend**: Located in the top-left corner, with three entries:
- **Blue dashed line**: Slope = 2.4082, *q₂* = 0.903.
- **Green dashed line**: Slope = 2.5207, *q₂* = 0.906.
- **Red dashed line**: Slope = 2.5297, *q₂* = 0.909.
- **Data Points**: Markers (blue, green, red) with error bars aligned with their respective linear fits.
---
### Detailed Analysis
1. **Blue Line (q₂ = 0.903)**:
- Slope = 2.4082.
- Data points (blue circles) align closely with the dashed line.
- Error bars are small, indicating low variability.
2. **Green Line (q₂ = 0.906)**:
- Slope = 2.5207.
- Data points (green squares) follow the dashed line tightly.
- Error bars slightly larger than blue but consistent.
3. **Red Line (q₂ = 0.909)**:
- Slope = 2.5297.
- Data points (red triangles) show the steepest trend.
- Error bars increase slightly at higher dimensions but remain proportional.
---
### Key Observations
- **Trend Verification**:
- All lines slope upward, confirming that the number of MC steps increases with dimension.
- Red line (highest slope) grows fastest, followed by green, then blue.
- **Spatial Grounding**:
- Legend is top-left; colors match data points and lines exactly.
- Error bars are centered on markers, with vertical orientation.
- **Data Consistency**:
- All slopes are distinct but close (2.4082–2.5297), suggesting minor parameter-driven differences.
- *q₂* values increase incrementally (0.903 → 0.909), correlating with steeper slopes.
---
### Interpretation
The graph demonstrates that the number of MC steps scales polynomially with dimension, with the rate of growth dependent on the parameter *q₂*. Higher *q₂* values (closer to 1) correspond to steeper slopes, implying that the computational cost rises more rapidly as dimension increases. The logarithmic scales emphasize exponential growth trends, highlighting the sensitivity of MC methods to dimensionality. The error bars suggest experimental or stochastic variability, but the linear fits indicate a strong underlying trend. This could inform optimization strategies for high-dimensional simulations by identifying parameter regimes that minimize computational overhead.