## Heatmap Grid: Digit Representation
### Overview
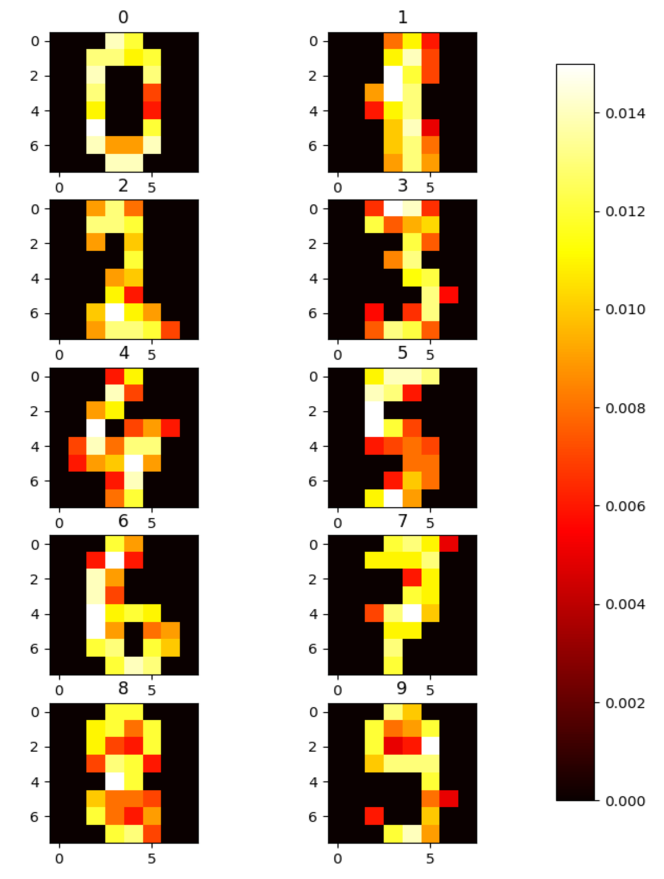
The image presents a grid of heatmaps, each representing a digit from 0 to 9. The heatmaps visualize the distribution of some value (likely probability or frequency) across an 8x8 grid for each digit. A colorbar on the right indicates the mapping between color intensity and value.
### Components/Axes
* **Heatmaps:** Ten individual heatmaps arranged in a 2x5 grid. Each heatmap represents a digit from 0 to 9.
* **X-axis (each heatmap):** Ranges from 0 to 7, with a marker at 5.
* **Y-axis (each heatmap):** Ranges from 0 to 7.
* **Colorbar:** Vertical colorbar on the right side of the image, ranging from 0.000 to 0.014. The color gradient goes from black (0.000) to red to orange to yellow (0.014).
* **Titles:** Each heatmap has a title indicating the digit it represents (0, 1, 2, 3, 4, 5, 6, 7, 8, 9).
### Detailed Analysis or ### Content Details
**Heatmap Values and Trends:**
* **Digit 0:** High values (yellow/orange) form a hollow oval shape.
* **Digit 1:** High values are concentrated in a vertical line on the right side of the grid.
* **Digit 2:** High values form a curve from the top-left to the bottom-right.
* **Digit 3:** High values are concentrated in the upper-right and lower-right portions of the grid.
* **Digit 4:** High values form a vertical line on the left and a horizontal line in the middle.
* **Digit 5:** High values are concentrated in the upper-right and lower-left portions of the grid.
* **Digit 6:** High values form a shape similar to '6', with a loop at the bottom.
* **Digit 7:** High values are concentrated in the top-right portion of the grid, with a diagonal line extending downwards.
* **Digit 8:** High values form two loops, one above the other.
* **Digit 9:** High values form a shape similar to '9', with a loop at the top.
**Colorbar Values:**
* 0.000: Black
* 0.002: Dark Red
* 0.004: Red
* 0.006: Orange-Red
* 0.008: Orange
* 0.010: Yellow-Orange
* 0.012: Yellow
* 0.014: Bright Yellow
### Key Observations
* Each digit has a unique heatmap signature, reflecting the distribution of values across the grid.
* The color intensity varies within each heatmap, indicating different levels of value concentration.
* The heatmaps provide a visual representation of the features that distinguish each digit.
### Interpretation
The heatmaps likely represent the average activation patterns of neurons in a neural network trained to recognize handwritten digits. The color intensity at each grid location indicates the importance or frequency of that pixel being activated when the corresponding digit is presented to the network. The distinct patterns for each digit suggest that the network has learned to extract unique features for each class. The values represent the probability or frequency of a pixel being activated for a given digit.