\n
## Heatmaps: Series of 2D Heatmaps
### Overview
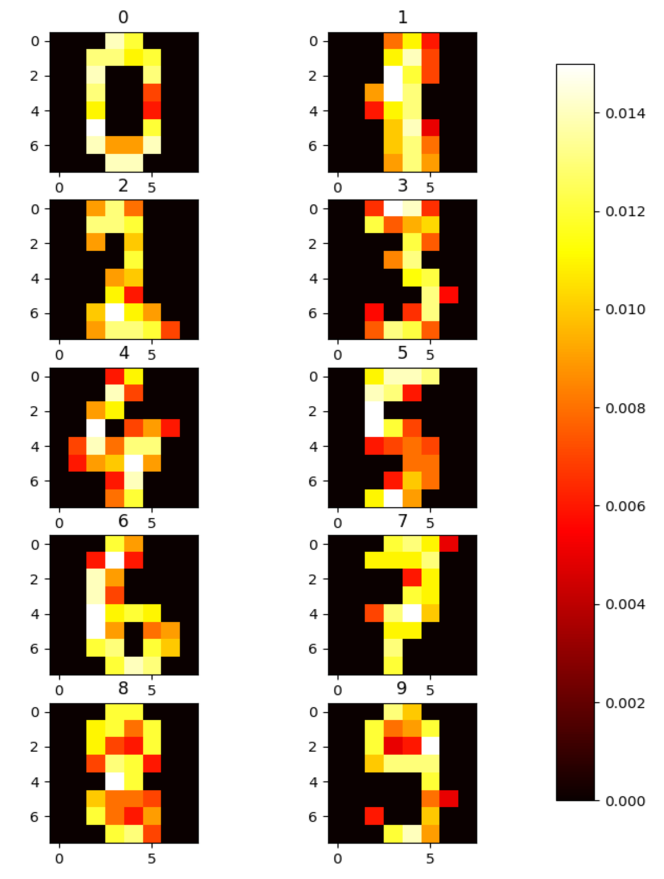
The image presents a 3x3 grid of 2D heatmaps, each representing a different state or time point. Each heatmap displays a color gradient representing a numerical value, with a legend on the right indicating the mapping between color and value. Each heatmap is labeled with a number in the top-left corner and two numbers below, likely representing coordinates or indices.
### Components/Axes
Each heatmap has implicit axes ranging from 0 to 7 on both the x and y axes. The colorbar on the right represents the value scale, ranging from 0.000 to 0.014. The grid arrangement is 3 rows and 3 columns. Each heatmap is labeled with a number in the top-left corner (0-9) and two numbers below.
### Detailed Analysis or Content Details
Let's analyze each heatmap individually, noting the approximate values based on the colorbar:
* **Heatmap 0:** (Top-left) Labeled "0" and "0 2 5". The central region shows values around 0.012-0.014 (yellow), surrounded by orange (around 0.008) and dark regions (close to 0.000).
* **Heatmap 1:** (Top-center) Labeled "1" and "0 3 5". The upper-right corner shows values around 0.013-0.014 (yellow). The rest of the heatmap shows values between 0.006 and 0.012 (orange to yellow).
* **Heatmap 2:** (Top-right) Labeled "2" and "0 4 5". The upper-right corner shows values around 0.010-0.012 (yellow). The lower-left corner is dark (close to 0.000).
* **Heatmap 3:** (Middle-left) Labeled "3" and "0 4 5". The central region shows values around 0.008-0.010 (yellow). The lower-left corner is dark (close to 0.000).
* **Heatmap 4:** (Middle-center) Labeled "4" and "0 5 5". The upper-right corner shows values around 0.012-0.014 (yellow). The lower-left corner is dark (close to 0.000).
* **Heatmap 5:** (Middle-right) Labeled "5" and "0 5 5". The upper-right corner shows values around 0.010-0.012 (yellow). The lower-left corner is dark (close to 0.000).
* **Heatmap 6:** (Bottom-left) Labeled "6" and "0 6 5". The central region shows values around 0.006-0.008 (orange). The lower-left corner is dark (close to 0.000).
* **Heatmap 7:** (Bottom-center) Labeled "7" and "0 7 5". The upper-right corner shows values around 0.008-0.010 (yellow). The lower-left corner is dark (close to 0.000).
* **Heatmap 8:** (Bottom-left) Labeled "8" and "0 8 5". The central region shows values around 0.006-0.008 (orange). The lower-left corner is dark (close to 0.000).
* **Heatmap 9:** (Bottom-right) Labeled "9" and "0 9 5". The upper-right corner shows values around 0.008-0.010 (yellow). The lower-left corner is dark (close to 0.000).
### Key Observations
* The highest values (around 0.014) consistently appear in the upper-right quadrant of several heatmaps (0, 1, 4).
* The lower-left quadrants of most heatmaps consistently show the lowest values (close to 0.000).
* The shape of the high-value regions varies across the heatmaps, suggesting a dynamic process.
* The numbers below each heatmap (e.g., "0 2 5") likely represent coordinates or indices within a larger dataset.
### Interpretation
The image likely represents a series of snapshots of a dynamic system, possibly a simulation or experimental data. The heatmaps visualize the distribution of a certain quantity (represented by the color gradient) across a 2D space. The consistent presence of high values in the upper-right and low values in the lower-left suggests a directional bias or gradient in the system. The changing shapes of the high-value regions across the heatmaps indicate that the system is evolving over time or in response to different conditions. The numbers below each heatmap could represent the x and y coordinates of the heatmap within a larger grid, or potentially time steps or other parameters. Without further context, it's difficult to determine the exact nature of the system being visualized, but the data suggests a dynamic process with a directional component. The values are relatively low, suggesting the quantity being measured is either inherently small or has been normalized.