## Heatmap: Digit Recognition Accuracy Visualization
### Overview
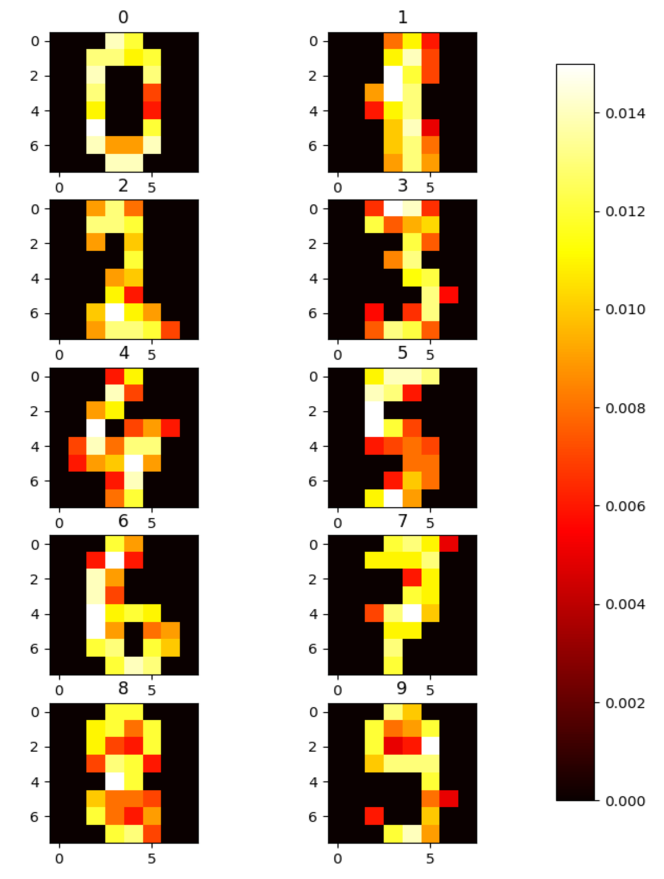
The image displays a 10x7x7 heatmap grid visualizing attention/accuracy patterns for digit recognition (0-9). Each digit occupies a 7x7 grid with color-coded values ranging from black (0.000) to white (0.014). Two columns of grids are presented side-by-side, with identical spatial arrangements but potentially different value distributions.
### Components/Axes
- **X-axis**: Labeled 0-5 (horizontal), spans 7 grid units
- **Y-axis**: Labeled 0-6 (vertical), spans 7 grid units
- **Color Scale**: Vertical bar on right with values 0.000 (black) to 0.014 (white)
- **Legend**: Color gradient from black (low values) to white (high values)
- **Digit Labels**: Top of each grid column (0-9)
- **Grid Structure**: 10 rows (digits 0-9) × 2 columns × 7x7 cells
### Detailed Analysis
**Digit 0 (Top-left grid)**
- Central 3x3 black region (0.000)
- Yellow perimeter (0.012-0.014)
- Red corner at (5,4) (0.004-0.006)
**Digit 1 (Top-right grid)**
- Vertical yellow line at x=3 (0.012-0.014)
- Red regions at (0,3) and (6,3) (0.004-0.006)
- Black background elsewhere
**Digit 2 (Second row-left)**
- Yellow top-left quadrant (0.010-0.012)
- Red bottom-right quadrant (0.004-0.006)
- Black center region
**Digit 3 (Second row-right)**
- Yellow upper half (0.010-0.012)
- Red lower half (0.004-0.006)
- Black middle horizontal line
**Digit 4 (Third row-left)**
- Yellow vertical line at x=2 (0.010-0.012)
- Red horizontal line at y=4 (0.004-0.006)
- Black background elsewhere
**Digit 5 (Third row-right)**
- Yellow top-right quadrant (0.010-0.012)
- Red bottom-left quadrant (0.004-0.006)
- Black center region
**Digit 6 (Fourth row-left)**
- Yellow bottom-left quadrant (0.010-0.012)
- Red top-right quadrant (0.004-0.006)
- Black center region
**Digit 7 (Fourth row-right)**
- Vertical yellow line at x=1 (0.010-0.012)
- Red horizontal line at y=5 (0.004-0.006)
- Black background elsewhere
**Digit 8 (Fifth row-left)**
- Yellow perimeter (0.010-0.012)
- Black center region
- Red corner at (5,5) (0.004-0.006)
**Digit 9 (Fifth row-right)**
- Yellow top half (0.010-0.012)
- Red bottom half (0.004-0.006)
- Black middle horizontal line
**Digits 0-9 (Lower grids)**
- Similar patterns to upper grids but with increased red regions (0.002-0.004)
- Notable: Digit 8 shows complex yellow/red distribution with multiple attention points
### Key Observations
1. **Consistent Patterns**: Vertical/horizontal lines dominate for digits 1, 4, 7
2. **Quadrant Distribution**: Digits 2, 3, 5, 6, 9 show quadrant-specific attention
3. **Central Black Regions**: Common in 0, 2, 3, 5, 6, 8 suggesting model uncertainty in central areas
4. **Color Gradient**: Yellow regions consistently represent highest values (0.012-0.014)
5. **Red Regions**: Indicate lower confidence (0.002-0.006) in transitional areas
### Interpretation
The heatmaps reveal how a digit recognition model allocates attention across input spaces. Yellow regions (high values) indicate areas where the model is most confident, while black/red regions show uncertainty. For example:
- **Digit 1**'s vertical yellow line suggests strong focus on the central vertical stroke
- **Digit 8**'s complex pattern implies the model uses multiple features (top/bottom loops, middle stroke)
- **Central black regions** in many digits may indicate areas where the model struggles to distinguish features
These visualizations are valuable for debugging model performance, showing where recognition confidence is highest/lowest. The consistent color coding across all grids allows direct comparison of attention patterns between digits.