## Line Charts: Training Metrics
### Overview
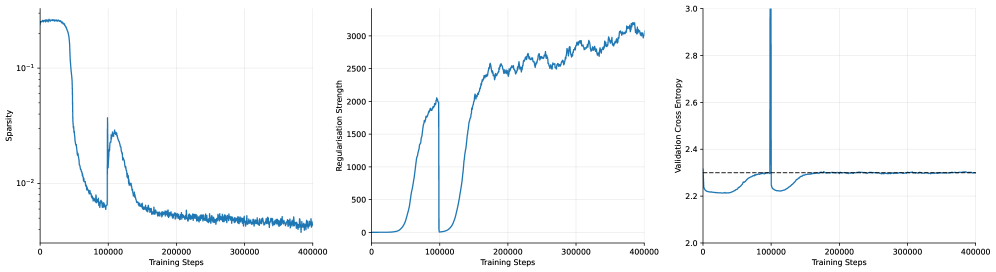
The image presents three line charts displaying the training metrics of a model over 400,000 training steps. The charts depict Sparsity, Regularisation Strength, and Validation Cross Entropy. All three charts share the same x-axis: "Training Steps".
### Components/Axes
**Chart 1: Sparsity**
* **Y-axis:** Sparsity (log scale)
* Scale ranges from approximately 0.005 to 0.2.
* Markers at 10^-2 and 10^-1.
* **X-axis:** Training Steps
* Scale ranges from 0 to 400,000.
* Markers at 0, 100,000, 200,000, 300,000, and 400,000.
**Chart 2: Regularisation Strength**
* **Y-axis:** Regularisation Strength
* Scale ranges from 0 to 3000.
* Markers at 0, 500, 1000, 1500, 2000, 2500, and 3000.
* **X-axis:** Training Steps
* Scale ranges from 0 to 400,000.
* Markers at 0, 100,000, 200,000, 300,000, and 400,000.
**Chart 3: Validation Cross Entropy**
* **Y-axis:** Validation Cross Entropy
* Scale ranges from 2.0 to 3.0.
* Markers at 2.0, 2.2, 2.4, 2.6, 2.8, and 3.0.
* **X-axis:** Training Steps
* Scale ranges from 0 to 400,000.
* Markers at 0, 100,000, 200,000, 300,000, and 400,000.
* A dashed horizontal line is present at approximately y = 2.3.
### Detailed Analysis
**Chart 1: Sparsity**
* **Trend:** The sparsity starts high (around 0.2), rapidly decreases until approximately 80,000 training steps, then experiences a sharp increase around 100,000 steps, followed by a gradual decrease and stabilization around 0.005 for the remainder of the training.
* **Data Points:**
* Initial Sparsity: ~0.2
* Sparsity at 80,000 steps: ~0.006
* Peak after increase: ~0.03
* Final Sparsity: ~0.005
**Chart 2: Regularisation Strength**
* **Trend:** The regularisation strength starts at 0, remains low until around 50,000 training steps, then rapidly increases until approximately 100,000 steps, drops back to 0, then increases again until approximately 200,000 steps, and then continues to increase more gradually with some fluctuations until the end of training.
* **Data Points:**
* Initial Regularisation Strength: 0
* Regularisation Strength at 100,000 steps: ~2000
* Regularisation Strength at 200,000 steps: ~2000
* Final Regularisation Strength: ~3000
**Chart 3: Validation Cross Entropy**
* **Trend:** The validation cross entropy starts around 2.2, decreases slightly until approximately 50,000 training steps, then increases sharply until approximately 100,000 steps, followed by a decrease and stabilization around 2.3 for the remainder of the training.
* **Data Points:**
* Initial Validation Cross Entropy: ~2.2
* Minimum Validation Cross Entropy: ~2.2
* Peak after increase: ~2.3
* Final Validation Cross Entropy: ~2.3
### Key Observations
* All three metrics exhibit significant changes around 50,000-100,000 training steps.
* Sparsity and Regularisation Strength appear to be inversely related in the initial phase of training.
* Validation Cross Entropy stabilizes after the initial fluctuations.
### Interpretation
The charts suggest that the model undergoes a significant adjustment phase during the first 100,000 training steps. The initial decrease in sparsity corresponds to an increase in regularisation strength, indicating that the model is learning to prioritize important features. The subsequent increase in validation cross entropy suggests a potential overfitting issue, which is then corrected as the model continues to train and the validation cross entropy stabilizes. The dashed line on the Validation Cross Entropy chart likely represents a target or acceptable level of validation error. The model appears to achieve and maintain this level after the initial adjustment period.