## Line Charts: Training Dynamics of a Machine Learning Model
### Overview
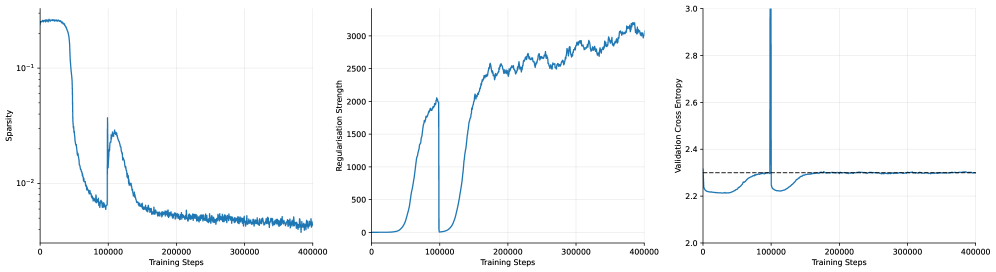
The image displays three horizontally aligned line charts that track different metrics over the course of model training. The charts share a common x-axis ("Training Steps") but monitor distinct y-axis variables: Sparsity, Regularization Strength, and Validation Cross Entropy. The data suggests a training process with a significant event or intervention occurring around 100,000 steps.
### Components/Axes
**Common X-Axis (All Charts):**
* **Label:** `Training Steps`
* **Scale:** Linear, from 0 to 400,000.
* **Major Tick Marks:** 0, 100000, 200000, 300000, 400000.
**Left Chart:**
* **Y-Axis Label:** `Sparsity`
* **Y-Axis Scale:** Logarithmic (base 10). Major ticks at `10^-2` (0.01) and `10^-1` (0.1).
* **Data Series:** A single blue line.
**Middle Chart:**
* **Y-Axis Label:** `Regularization Strength`
* **Y-Axis Scale:** Linear, from 0 to 3000.
* **Major Tick Marks:** 0, 500, 1000, 1500, 2000, 2500, 3000.
* **Data Series:** A single blue line.
**Right Chart:**
* **Y-Axis Label:** `Validation Cross Entropy`
* **Y-Axis Scale:** Linear, from 2.0 to 3.0.
* **Major Tick Marks:** 2.0, 2.2, 2.4, 2.6, 2.8, 3.0.
* **Data Series:** A single blue line.
* **Additional Element:** A horizontal dashed black line at approximately y = 2.3.
### Detailed Analysis
**1. Sparsity (Left Chart):**
* **Trend:** The line begins at a high sparsity value (≈0.2-0.3) and remains stable until approximately 50,000 steps. It then undergoes a steep, near-vertical drop to a minimum near `10^-2` (0.01) around 75,000 steps. Following this, there is a sharp rebound, forming a peak of ≈0.03-0.04 at 100,000 steps. After this peak, the sparsity decays exponentially, stabilizing at a low, noisy baseline between `10^-2` and `2x10^-2` from 200,000 steps onward.
* **Key Points (Approximate):**
* Start (0 steps): ~0.25
* Minimum (~75k steps): ~0.01
* Local Peak (100k steps): ~0.035
* End (400k steps): ~0.015 (with noise)
**2. Regularization Strength (Middle Chart):**
* **Trend:** The line starts near zero and remains low until ≈50,000 steps. It then rises sharply, forming a first major peak of ≈2000 at 100,000 steps. Immediately after this peak, the value plummets back to near zero. From ≈125,000 steps, it begins a second, more sustained ascent, characterized by high-frequency noise/fluctuations. This second rise continues throughout the training, reaching its maximum value of ≈3100-3200 by 400,000 steps.
* **Key Points (Approximate):**
* First Peak (100k steps): ~2000
* Trough (~110k steps): ~50
* Value at 200k steps: ~2500
* End (400k steps): ~3150
**3. Validation Cross Entropy (Right Chart):**
* **Trend:** The line is remarkably stable, hovering just below the dashed reference line (≈2.3) for almost the entire training duration. The most prominent feature is an extreme, narrow spike where the cross-entropy shoots up to the maximum y-axis value of 3.0 precisely at 100,000 steps. It immediately returns to its baseline level. A very slight, temporary dip is visible just before the spike.
* **Key Points (Approximate):**
* Baseline (most of training): ~2.28 - 2.30
* Spike Peak (100k steps): 3.0
* Dashed Reference Line: ~2.3
### Key Observations
1. **Synchronized Event at 100,000 Steps:** All three metrics exhibit a dramatic, simultaneous change at exactly 100,000 training steps. Sparsity peaks, Regularization Strength peaks and then crashes, and Validation Cross Entropy spikes to its maximum.
2. **Two-Phase Regularization:** The Regularization Strength plot shows two distinct phases: an initial sharp increase and reset, followed by a noisier, sustained increase.
3. **Stable Validation Performance:** Despite the dramatic internal changes (sparsity, regularization), the model's validation loss (cross entropy) remains largely unaffected, except for the single anomalous spike. The dashed line suggests a target or baseline performance level that is consistently met.
4. **Sparsity Dynamics:** The model's sparsity is highly dynamic early in training, undergoing a collapse and recovery before settling into a low, stable regime.
### Interpretation
This set of charts likely visualizes the training dynamics of a neural network employing a **dynamic or adaptive regularization technique**, possibly related to pruning or sparsity induction (e.g., a method that adjusts regularization strength based on gradient statistics or model weights).
* **The 100k-Step Event:** The synchronized anomaly strongly suggests a planned intervention or a phase transition in the training algorithm. This could be:
* A scheduled change in the learning rate or optimization hyperparameters.
* The activation or deactivation of a specific regularization component.
* A "reset" or "re-evaluation" point in an adaptive algorithm, where the regularization strength is recalculated, causing a temporary disruption (the cross-entropy spike) before recovery.
* **Relationship Between Metrics:** The data implies a causal relationship. The initial rise in Regularization Strength (50k-100k steps) correlates with the collapse in Sparsity. The event at 100k steps resets the regularization, allowing sparsity to recover slightly. The subsequent sustained increase in regularization does not further reduce sparsity, suggesting the model has reached a stable sparse state. The validation loss remains robust, indicating these internal adjustments do not harm generalization (outside the transient spike).
* **Purpose of the Dashed Line:** The horizontal dashed line in the Validation Cross Entropy chart serves as a performance benchmark. The model's ability to stay at or below this line for nearly all steps (except the spike) demonstrates successful training relative to that target.
**In summary, the image documents a training run where an adaptive regularization mechanism is actively modulating model sparsity. A critical algorithmic event at 100,000 steps causes a temporary loss spike but is followed by recovery and continued stable training, ultimately maintaining validation performance at a desired benchmark level.**