## Line Graphs: Training Metrics Over Steps
### Overview
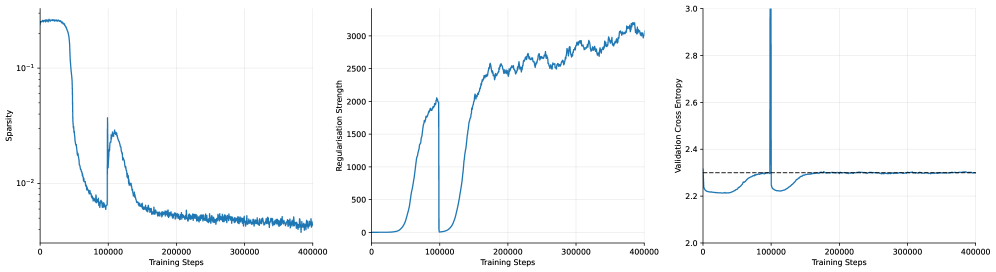
The image contains three line graphs depicting training metrics across 400,000 training steps. Each graph tracks a distinct metric: sparsity, regularization strength, and validation cross entropy. All graphs share the same x-axis (training steps) but have unique y-axes and trends.
---
### Components/Axes
1. **Left Graph (Sparsity)**
- **Y-axis**: "Sparsity" (logarithmic scale: 10⁻¹ to 10⁻²)
- **X-axis**: "Training Steps" (0 to 400,000)
- **Line**: Blue, single data series.
2. **Middle Graph (Regularisation Strength)**
- **Y-axis**: "Regularisation Strength" (linear scale: 0 to 3,000)
- **X-axis**: "Training Steps" (0 to 400,000)
- **Line**: Blue, single data series.
3. **Right Graph (Validation Cross Entropy)**
- **Y-axis**: "Validation Cross Entropy" (linear scale: 2.0 to 3.0)
- **X-axis**: "Training Steps" (0 to 400,000)
- **Line**: Blue, single data series.
- **Dashed Line**: Horizontal reference at ~2.4.
---
### Detailed Analysis
#### Left Graph (Sparsity)
- **Initial Drop**: Sparsity plunges from ~10⁻¹ to ~10⁻² within ~50,000 steps.
- **Secondary Peak**: A sharp spike to ~10⁻¹ occurs at ~100,000 steps, followed by a rapid decline.
- **Stabilization**: Settles near ~10⁻² between 200,000 and 400,000 steps.
#### Middle Graph (Regularisation Strength)
- **Initial Rise**: Gradual increase from 0 to ~1,500 by ~100,000 steps.
- **Sharp Drop**: Plummets to ~0 at ~100,000 steps.
- **Secondary Rise**: Peaks at ~2,500 around 200,000 steps, then fluctuates between 2,000–2,500 until 400,000 steps.
#### Right Graph (Validation Cross Entropy)
- **Initial Stability**: Remains near 2.2 until ~100,000 steps.
- **Sharp Spike**: Jumps to ~2.8 at ~100,000 steps, then drops back to ~2.2.
- **Final Stability**: Fluctuates slightly (~2.2–2.3) but remains stable after 200,000 steps.
- **Dashed Line**: Horizontal reference at ~2.4, indicating a target or threshold.
---
### Key Observations
1. **Sparsity**: Initial high sparsity drops sharply, with a brief rebound at 100k steps before stabilizing.
2. **Regularisation Strength**: Two distinct phases—initial growth, abrupt reset, then gradual increase with fluctuations.
3. **Validation Cross Entropy**: A single catastrophic spike at 100k steps, followed by recovery and stability.
4. **Dashed Line**: The ~2.4 threshold in the right graph is never consistently met, suggesting suboptimal validation performance.
---
### Interpretation
- **Sparsity & Regularisation**: The sharp drop in sparsity and regularisation strength at 100k steps suggests a major model adjustment (e.g., weight pruning or hyperparameter tuning). The subsequent rise in regularisation strength may indicate rebalancing to prevent overfitting.
- **Validation Cross Entropy Spike**: The 100k-step spike in validation error implies overfitting or instability during model adjustment. The recovery afterward suggests the model stabilized post-adjustment.
- **Dashed Line Significance**: The ~2.4 threshold likely represents a target validation error. The model’s inability to sustainably meet this threshold indicates room for improvement in regularisation or architecture.
- **Correlation**: The synchronization of spikes in sparsity, regularisation, and validation error at 100k steps implies a coordinated training intervention (e.g., learning rate change or layer freezing).
The data highlights critical phases in training dynamics, emphasizing the interplay between model complexity (sparsity), regularisation, and validation performance.