\n
## Data Table: Operation Latency
### Overview
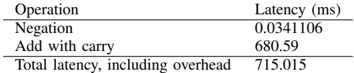
The image presents a data table detailing the latency (in milliseconds) of two specific operations: "Negation" and "Add with carry". It also provides the total latency, including overhead.
### Components/Axes
The table has two columns:
* **Operation:** Lists the type of operation performed.
* **Latency (ms):** Indicates the time taken for the operation to complete, measured in milliseconds.
### Detailed Analysis or Content Details
The table contains the following data:
* **Negation:** Latency is 0.0341106 ms.
* **Add with carry:** Latency is 680.59 ms.
* **Total latency, including overhead:** 715.015 ms.
### Key Observations
The latency of "Add with carry" is significantly higher than that of "Negation". The total latency is only slightly higher than the "Add with carry" latency, suggesting that the overhead is relatively small compared to the "Add with carry" operation.
### Interpretation
This data suggests that the "Add with carry" operation is the dominant factor in the overall latency. The negligible latency of "Negation" indicates it is a very fast operation. The difference in latency between the two operations could be due to the complexity of the "Add with carry" operation, potentially involving more computational steps or resource access. The total latency provides a realistic measure of the time taken to perform these operations in a practical setting, accounting for any additional overhead. This information is valuable for performance analysis and optimization of systems where these operations are frequently used.