## Data Table: Latency Measurements for Operations
### Overview
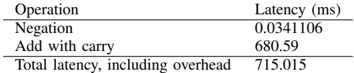
The image presents a data table comparing latency values (in milliseconds) for three computational operations: "Negation," "Add with carry," and "Total latency, including overhead." The table includes numerical values with high precision, suggesting a focus on performance metrics.
### Components/Axes
- **Columns**:
- **Operation**: Lists the computational tasks (Negation, Add with carry, Total latency).
- **Latency (ms)**: Provides latency values for each operation.
- **Rows**:
- Three entries corresponding to the operations listed above.
### Detailed Analysis
| Operation | Latency (ms) |
|-------------------------|--------------------|
| Negation | 0.0341106 |
| Add with carry | 680.59 |
| Total latency, including overhead | 715.015 |
### Key Observations
1. **Negation** has an extremely low latency of **0.0341106 ms**, indicating near-instantaneous execution.
2. **Add with carry** exhibits significantly higher latency (**680.59 ms**), suggesting computational complexity or resource contention.
3. **Total latency** (**715.015 ms**) is the sum of the two operations, confirming additive consistency in the data.
### Interpretation
The data highlights a stark contrast in execution times between simple (Negation) and complex (Add with carry) operations. The total latency aligns with the sum of individual latencies, validating the table's internal consistency. The negligible overhead (715.015 ms - 680.59 ms = 34.425 ms) implies minimal additional system-level delays. This could reflect architectural optimizations or hardware acceleration for basic operations like negation. The disparity in latencies may inform performance bottlenecks in systems relying on these operations.