## Scatter Plot: LiveCodeBench v5 Performance vs. Total Parameters
### Overview
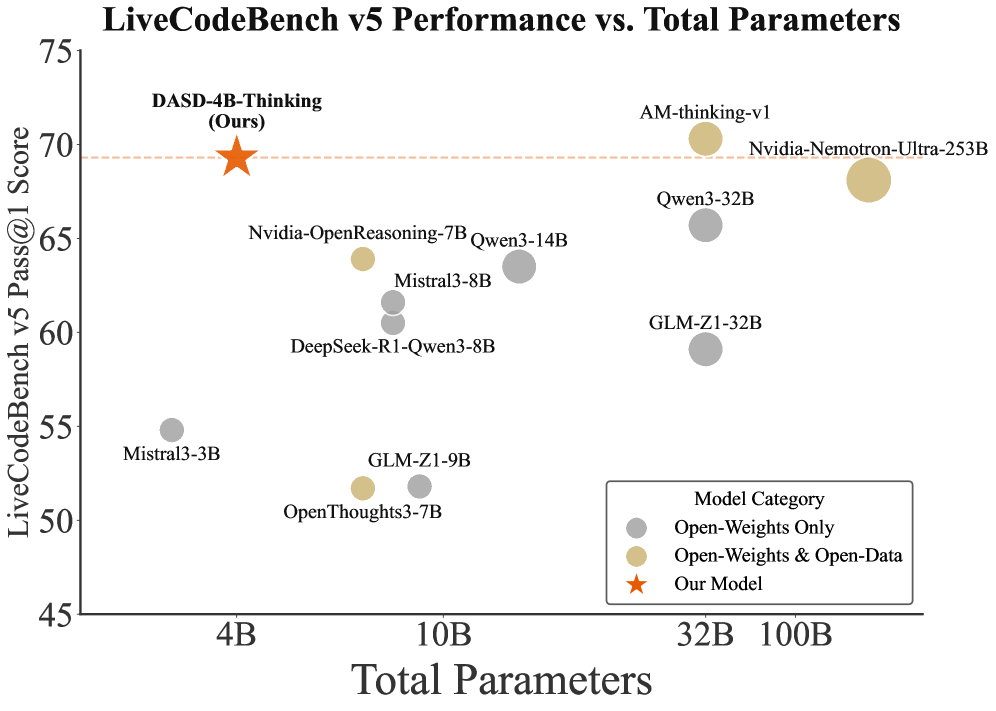
The chart compares the performance of various AI models on the LiveCodeBench v5 benchmark against their total parameter counts. Performance is measured as "Pass@1 Score" (y-axis), while model size is represented by "Total Parameters" (x-axis). Three model categories are distinguished by color: Open-Weights Only (gray), Open-Weights & Open-Data (beige), and a highlighted "Our Model" (orange star).
### Components/Axes
- **Y-Axis**: "LiveCodeBench v5 Pass@1 Score" (45–75)
- **X-Axis**: "Total Parameters" (4B–100B)
- **Legend**:
- Gray circles: Open-Weights Only
- Beige circles: Open-Weights & Open-Data
- Orange star: Our Model
### Detailed Analysis
1. **Model Data Points**:
- **DASD-4B-Thinking (Our Model)**: 4B parameters, 70 score (orange star)
- **Nvidia-OpenReasoning-7B**: 7B parameters, ~63.5 score (beige)
- **Qwen3-14B**: 14B parameters, ~62.5 score (gray)
- **Mistral3-8B**: 8B parameters, ~61 score (gray)
- **DeepSeek-R1-Qwen3-8B**: 8B parameters, ~60.5 score (gray)
- **GLM-Z1-9B**: 9B parameters, ~52.5 score (beige)
- **OpenThoughts3-7B**: 7B parameters, ~51.5 score (gray)
- **Mistral3-3B**: 3B parameters, ~55 score (gray)
- **GLM-Z1-32B**: 32B parameters, ~59.5 score (gray)
- **Qwen3-32B**: 32B parameters, ~65.5 score (gray)
- **AM-thinking-v1**: 32B parameters, 70 score (beige)
- **Nvidia-Nemotron-Ultra-253B**: 253B parameters, 70 score (beige)
2. **Trends**:
- **Open-Weights & Open-Data (beige)**: Higher scores cluster at 32B+ parameters (e.g., AM-thinking-v1, Nvidia-Nemotron-Ultra-253B).
- **Open-Weights Only (gray)**: Lower scores (51–63) across 3B–32B parameters.
- **Our Model (DASD-4B-Thinking)**: Exceptional performance (70 score) at 4B parameters, outperforming larger models in its category.
### Key Observations
- **Efficiency Outlier**: DASD-4B-Thinking achieves a 70 score with only 4B parameters, surpassing larger models like Qwen3-32B (65.5 score) and GLM-Z1-32B (59.5 score).
- **Parameter-Score Relationship**: Larger models (100B+) do not consistently yield higher scores, suggesting diminishing returns beyond a certain scale.
- **Category Performance**: Open-Weights & Open-Data models dominate the highest score tier (70), while Open-Weights Only models lag behind.
### Interpretation
The data highlights a trade-off between model size and efficiency. While larger models (e.g., Nvidia-Nemotron-Ultra-253B) achieve competitive scores, DASD-4B-Thinking demonstrates that smaller, optimized models can match or exceed their performance. This suggests that architectural innovation and training strategies (e.g., combining open weights with open data) may be more critical than sheer parameter count. The orange star ("Our Model") serves as a focal point, emphasizing the potential of lightweight, purpose-driven architectures in code generation tasks.