## Scatter Plot: LiveCodeBench v5 Performance vs. Total Parameters
### Overview
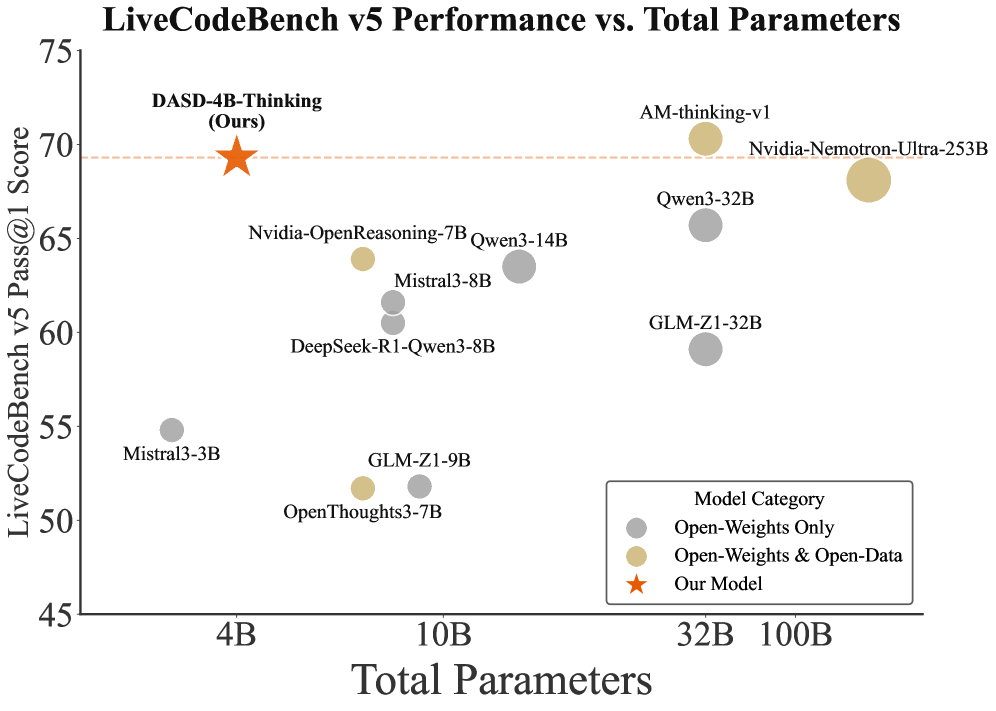
The image is a scatter plot comparing the performance of various language models on the LiveCodeBench v5 benchmark against their total number of parameters. The plot displays models with different categories (Open-Weights Only, Open-Weights & Open-Data, and "Our Model") using different colored markers. The x-axis represents the total parameters, and the y-axis represents the LiveCodeBench v5 Pass@1 score.
### Components/Axes
* **Title:** LiveCodeBench v5 Performance vs. Total Parameters
* **X-axis:** Total Parameters (labeled with 4B, 10B, 32B, 100B)
* **Y-axis:** LiveCodeBench v5 Pass@1 Score (labeled with 45, 50, 55, 60, 65, 70, 75)
* **Legend (bottom-right):**
* Gray circle: Open-Weights Only
* Tan circle: Open-Weights & Open-Data
* Orange star: Our Model
* **Horizontal dashed line:** At y=70
### Detailed Analysis
**Data Points and Trends:**
* **DASD-4B-Thinking (Ours):** (Orange Star) Located at approximately (4B, 69).
* **Mistral3-3B:** (Gray Circle) Located at approximately (4B, 55).
* **OpenThoughts3-7B:** (Tan Circle) Located at approximately (7B, 51).
* **GLM-Z1-9B:** (Tan Circle) Located at approximately (8B, 52).
* **Nvidia-OpenReasoning-7B:** (Tan Circle) Located at approximately (8B, 64).
* **Qwen3-14B:** (Gray Circle) Located at approximately (12B, 63).
* **Mistral3-8B:** (Gray Circle) Located at approximately (9B, 62).
* **DeepSeek-R1-Qwen3-8B:** (Gray Circle) Located at approximately (9B, 61).
* **GLM-Z1-32B:** (Gray Circle) Located at approximately (28B, 59).
* **Qwen3-32B:** (Gray Circle) Located at approximately (35B, 67).
* **AM-thinking-v1:** (Tan Circle) Located at approximately (40B, 70).
* **Nvidia-Nemotron-Ultra-253B:** (Tan Circle) Located at approximately (70B, 68).
### Key Observations
* The "Our Model" (DASD-4B-Thinking) achieves a high LiveCodeBench score with a relatively small number of parameters.
* Models with "Open-Weights & Open-Data" (Tan Circles) tend to have higher performance compared to "Open-Weights Only" models (Gray Circles) for a similar number of parameters.
* There is no clear linear correlation between the number of parameters and the LiveCodeBench score. Some models with fewer parameters outperform models with significantly more parameters.
### Interpretation
The scatter plot suggests that model performance on the LiveCodeBench v5 benchmark is not solely determined by the number of parameters. Factors such as model architecture, training data, and training methodology likely play a significant role. The "Our Model" data point highlights the potential for achieving high performance with efficient model design. The distinction between "Open-Weights Only" and "Open-Weights & Open-Data" models suggests that access to open data can positively impact model performance. The lack of a strong correlation indicates that simply increasing the number of parameters does not guarantee improved performance.