\n
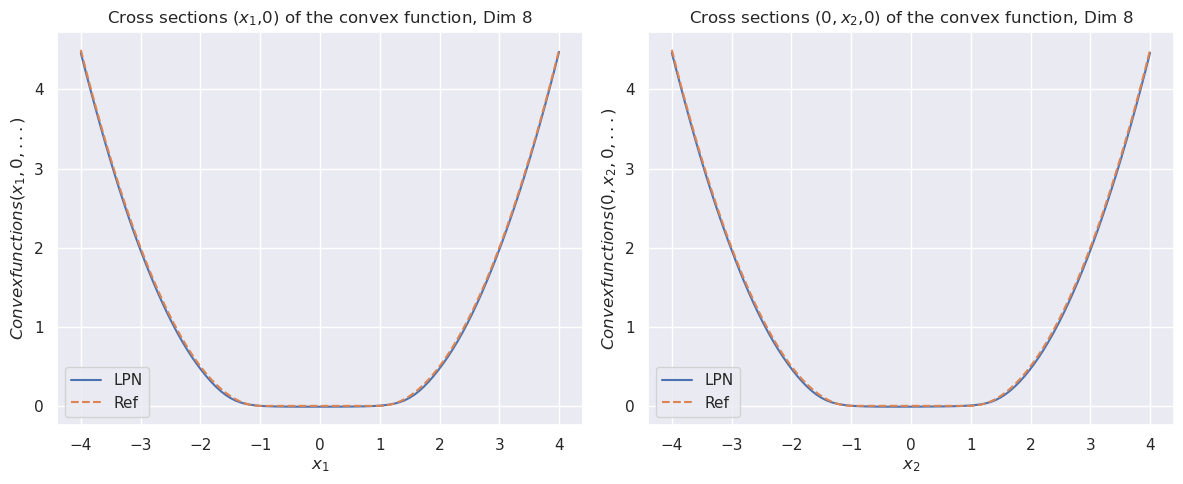
## Charts: Cross Sections of a Convex Function
### Overview
The image presents two charts, both depicting cross-sections of a convex function in 8 dimensions. The first chart shows the cross-section along the x1 axis, while the second shows the cross-section along the x2 axis. Both charts compare the function's behavior for two models: "LPN" (solid blue line) and "Ref" (dashed orange line). Both charts share the same y-axis scale and a similar x-axis scale.
### Components/Axes
Both charts share the following components:
* **Title:** "Cross sections (x1,0,0) of the convex function, Dim 8" (left chart) and "Cross sections (0,x2,0) of the convex function, Dim 8" (right chart).
* **X-axis Label:** "x1" (left chart) and "x2" (right chart). The x-axis ranges from approximately -4 to 4.
* **Y-axis Label:** "Convexfunctions(x1, 0, ...)" (left chart) and "Convexfunctions(0, x2, ...)" (right chart). The y-axis ranges from approximately 0 to 4.5.
* **Legend:** Located in the bottom-left corner of each chart.
* "LPN" - represented by a solid blue line.
* "Ref" - represented by a dashed orange line.
* **Grid:** A light gray grid is present on both charts to aid in reading values.
### Detailed Analysis or Content Details
**Left Chart (x1 cross-section):**
* **LPN (Solid Blue Line):** The line exhibits a parabolic shape, opening upwards. It reaches a minimum value of approximately 0 at x1 = 0. The line rises symmetrically on both sides of x1 = 0.
* At x1 = -4, the value is approximately 4.2.
* At x1 = -2, the value is approximately 1.2.
* At x1 = 2, the value is approximately 1.2.
* At x1 = 4, the value is approximately 4.2.
* **Ref (Dashed Orange Line):** This line also exhibits a parabolic shape, opening upwards, but is shifted slightly to the right and has a slightly different curvature. It reaches a minimum value of approximately 0 at x1 = 0.
* At x1 = -4, the value is approximately 4.5.
* At x1 = -2, the value is approximately 1.5.
* At x1 = 2, the value is approximately 1.5.
* At x1 = 4, the value is approximately 4.5.
**Right Chart (x2 cross-section):**
* **LPN (Solid Blue Line):** Similar to the left chart, this line is parabolic, opening upwards, and symmetric around x2 = 0, with a minimum value of approximately 0 at x2 = 0.
* At x2 = -4, the value is approximately 4.2.
* At x2 = -2, the value is approximately 1.2.
* At x2 = 2, the value is approximately 1.2.
* At x2 = 4, the value is approximately 4.2.
* **Ref (Dashed Orange Line):** Also parabolic, opening upwards, and symmetric around x2 = 0, with a minimum value of approximately 0 at x2 = 0.
* At x2 = -4, the value is approximately 4.5.
* At x2 = -2, the value is approximately 1.5.
* At x2 = 2, the value is approximately 1.5.
* At x2 = 4, the value is approximately 4.5.
### Key Observations
* Both models ("LPN" and "Ref") exhibit similar parabolic behavior in both cross-sections.
* The "Ref" model consistently has slightly higher values than the "LPN" model across the entire range of x1 and x2.
* Both functions are symmetric around the origin (x=0) in both dimensions.
* The minimum value of both functions is approximately 0 in both dimensions.
### Interpretation
The charts demonstrate the behavior of a convex function in 8 dimensions when sliced along two of its dimensions (x1 and x2). The comparison between the "LPN" and "Ref" models suggests that "LPN" provides a slightly better (lower) approximation of the function's value in these cross-sections. The parabolic shape confirms the function's convexity. The symmetry indicates that the function does not have a directional bias along these axes. The consistent difference between the two models suggests a systematic bias in the "Ref" model. The fact that both models are similar suggests that the underlying function is well-behaved and that both models are capturing its essential characteristics. The charts provide a visual representation of how these models differ in their approximation of the convex function's value.