## Data Table: Probability Distribution
### Overview
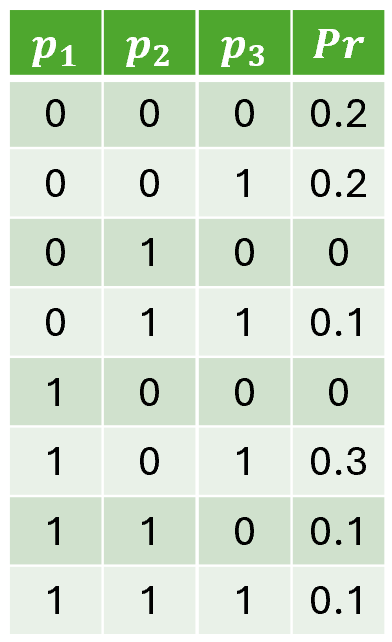
The image presents a data table showing a probability distribution over three binary variables (p1, p2, p3) and their corresponding probabilities (Pr). The table lists all possible combinations of the binary variables and their associated probabilities.
### Components/Axes
* **Columns:**
* p1: Binary variable 1 (0 or 1)
* p2: Binary variable 2 (0 or 1)
* p3: Binary variable 3 (0 or 1)
* Pr: Probability associated with the combination of p1, p2, and p3
### Detailed Analysis or ### Content Details
The table contains the following data:
| p1 | p2 | p3 | Pr |
| -- | -- | -- | --- |
| 0 | 0 | 0 | 0.2 |
| 0 | 0 | 1 | 0.2 |
| 0 | 1 | 0 | 0 |
| 0 | 1 | 1 | 0.1 |
| 1 | 0 | 0 | 0 |
| 1 | 0 | 1 | 0.3 |
| 1 | 1 | 0 | 0.1 |
| 1 | 1 | 1 | 0.1 |
### Key Observations
* The probabilities sum to 1.0 (0.2 + 0.2 + 0 + 0.1 + 0 + 0.3 + 0.1 + 0.1 = 1.0).
* The combination (1, 0, 1) has the highest probability (0.3).
* The combinations (0, 1, 0) and (1, 0, 0) have zero probability.
### Interpretation
The table represents a joint probability distribution over three binary variables. It specifies the probability of each possible combination of the variables. The distribution is not uniform, as some combinations are more likely than others. The zero probabilities indicate that certain combinations are impossible or highly unlikely under the given distribution.