## Data Table: Probability Distribution for Three Binary Variables
### Overview
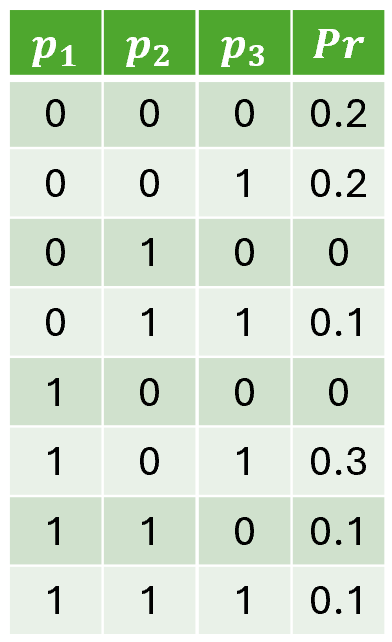
The image displays a structured data table with four columns and nine rows (including the header). It presents a probability distribution over all possible combinations of three binary variables, labeled `p1`, `p2`, and `p3`. The final column, `Pr`, lists the probability associated with each combination. The table uses a green color scheme for the header and alternating row shading for readability.
### Components/Axes
* **Header Row (Green Background):**
* Column 1: `p1`
* Column 2: `p2`
* Column 3: `p3`
* Column 4: `Pr`
* **Data Rows:** Eight rows representing the 2³ = 8 possible states of the three binary variables. Each variable takes a value of either `0` or `1`.
* **Color Coding:** The header row has a solid green background. Data rows alternate between a light green and a very light grey/white background.
### Content Details
The table is a complete enumeration of states. The following data is extracted precisely from the image:
| `p1` | `p2` | `p3` | `Pr` |
| :--- | :--- | :--- | :--- |
| 0 | 0 | 0 | 0.2 |
| 0 | 0 | 1 | 0.2 |
| 0 | 1 | 0 | 0 |
| 0 | 1 | 1 | 0.1 |
| 1 | 0 | 0 | 0 |
| 1 | 0 | 1 | 0.3 |
| 1 | 1 | 0 | 0.1 |
| 1 | 1 | 1 | 0.1 |
**Trend/Verification:** The probabilities (`Pr`) are non-negative and sum to 1.0 (0.2+0.2+0+0.1+0+0.3+0.1+0.1 = 1.0), confirming this is a valid probability mass function over the discrete sample space.
### Key Observations
1. **Zero-Probability States:** Two combinations have a probability of 0: (`p1=0, p2=1, p3=0`) and (`p1=1, p2=0, p3=0`). These outcomes are considered impossible under this model.
2. **Highest Probability State:** The combination (`p1=1, p2=0, p3=1`) has the highest probability at 0.3.
3. **Lowest Non-Zero Probability:** Three states share the lowest non-zero probability of 0.1: (`0,1,1`), (`1,1,0`), and (`1,1,1`).
4. **Distribution Shape:** The distribution is not uniform. Probability mass is concentrated on states where `p3=1` (total probability 0.2+0.1+0.3+0.1 = 0.7) versus `p3=0` (total probability 0.2+0+0+0.1 = 0.3).
### Interpretation
This table defines a joint probability distribution for three interdependent binary variables. It is a foundational component for probabilistic models like Bayesian networks or Markov random fields.
* **What the data suggests:** The variables are not independent. The probability of a state depends on the specific combination of all three variables. For example, `p1=1` is not inherently more or less likely; its probability is contingent on the values of `p2` and `p3`.
* **How elements relate:** The `Pr` column is a function of the triplet (`p1`, `p2`, `p3`). The table exhaustively maps the input space (all binary triplets) to an output probability.
* **Notable patterns/anomalies:** The two zero-probability states are significant. They imply a hard constraint or logical impossibility within the system being modeled. For instance, they might represent rules such as "If `p2` is true, `p1` and `p3` cannot both be false" (violated by row 3) or "If `p1` is true and `p2` is false, then `p3` must be true" (violated by row 5). The concentration of probability on states where `p3=1` suggests that variable `p3` is more frequently active or true in this model.