## Data Table: Binary Input Combinations and Probability Outcomes
### Overview
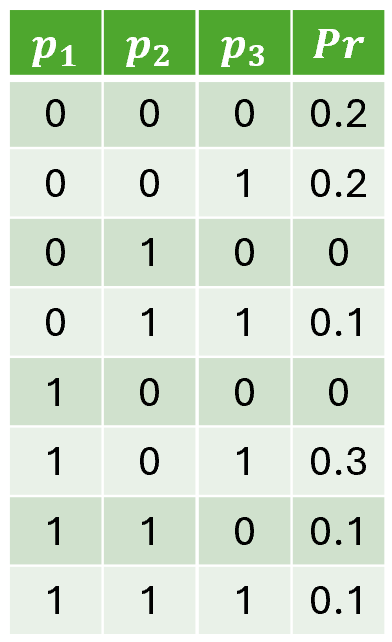
The image displays a structured table with four columns (`p1`, `p2`, `p3`, `Pr`) and eight rows. The first three columns contain binary values (0 or 1), while the fourth column (`Pr`) contains decimal values ranging from 0.0 to 0.3. The table appears to represent probabilistic outcomes based on combinations of binary inputs.
### Components/Axes
- **Columns**:
- `p1`, `p2`, `p3`: Binary input variables (0 or 1).
- `Pr`: Probability or outcome value (decimal, e.g., 0.2, 0.3).
- **Rows**: Each row represents a unique combination of `p1`, `p2`, and `p3` values, with a corresponding `Pr` value.
### Detailed Analysis
| Row | p1 | p2 | p3 | Pr |
|-----|----|----|----|-----|
| 1 | 0 | 0 | 0 | 0.2 |
| 2 | 0 | 0 | 1 | 0.2 |
| 3 | 0 | 1 | 0 | 0.0 |
| 4 | 0 | 1 | 1 | 0.1 |
| 5 | 1 | 0 | 0 | 0.0 |
| 6 | 1 | 0 | 1 | 0.3 |
| 7 | 1 | 1 | 0 | 0.1 |
| 8 | 1 | 1 | 1 | 0.1 |
- **Key Patterns**:
- When `p1=0`, `Pr` is consistently 0.2 for `p3=0` and `p3=1` (rows 1–2).
- Introducing `p2=1` reduces `Pr` to 0.0 or 0.1, depending on `p3` (rows 3–4).
- When `p1=1`, `Pr` varies significantly:
- `p1=1`, `p2=0`, `p3=1` yields the highest `Pr` (0.3, row 6).
- `p1=1`, `p2=1` combinations result in `Pr=0.1` (rows 7–8).
### Key Observations
1. **Highest Probability**: The combination `p1=1`, `p2=0`, `p3=1` produces the maximum `Pr` (0.3).
2. **Zero Probability**: Two combinations (`p1=0`, `p2=1`, `p3=0` and `p1=1`, `p2=0`, `p3=0`) result in `Pr=0.0`.
3. **Symmetry in `p1=0`**: For `p1=0`, `Pr` remains stable at 0.2 regardless of `p2` and `p3` values.
4. **Impact of `p2=1`**: When `p2=1`, `Pr` decreases unless mitigated by `p3=1` (e.g., `p1=0`, `p2=1`, `p3=1` → `Pr=0.1`).
### Interpretation
The table likely represents a probabilistic model where:
- **`p1`** acts as a primary driver of `Pr`, with `p1=1` enabling higher probabilities (up to 0.3).
- **`p2`** introduces a dampening effect on `Pr`, reducing it to 0.0 or 0.1 unless mitigated by `p3=1`.
- **`p3`** modulates the relationship between `p1` and `p2`, with `p3=1` partially offsetting the negative impact of `p2=1`.
Notably, the absence of `p1=1` in rows 1–4 suggests that `p1` is a necessary condition for non-zero `Pr` values. The model may reflect a scenario where `p1` enables a process, `p2` introduces a constraint, and `p3` provides a compensatory adjustment. The highest `Pr` (0.3) occurs when `p1` and `p3` are active while `p2` is inactive, indicating an optimal configuration.