# Technical Document Extraction: Heatmap Analysis
## Image Description
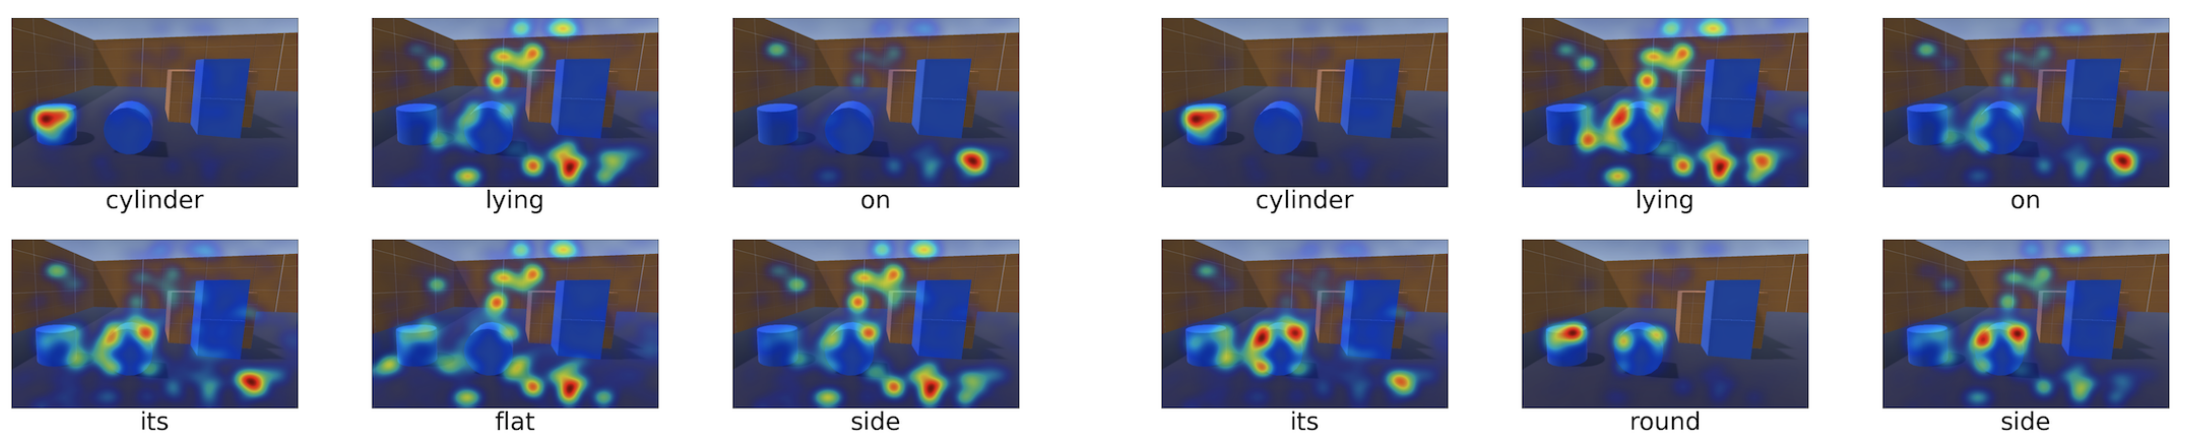
The image consists of a 2x6 grid of heatmaps, each labeled with categorical text. The heatmaps visualize spatial data distributions using a color gradient (blue to red), likely representing intensity or frequency. No explicit legend, axis titles, or numerical data is present.
---
### **Key Components**
1. **Heatmap Structure**
- **Grid Layout**: 2 rows × 6 columns.
- **Color Gradient**: Blue (low intensity) → Red (high intensity).
- **Labels**: Each heatmap has a single-word label below it.
2. **Labels (Left to Right, Top to Bottom)**
- **Top Row**:
`cylinder`, `lying`, `on`, `cylinder`, `lying`, `on`
- **Bottom Row**:
`its`, `flat`, `side`, `its`, `round`, `side`
3. **Spatial Patterns**
- **Top Row**:
- `cylinder`: Red spot on the left side.
- `lying`: Scattered red spots across the center.
- `on`: Red spot on the right side.
- Repeats for the second `cylinder`, `lying`, `on`.
- **Bottom Row**:
- `its`: Scattered red spots (similar to `lying`).
- `flat`: Red spot on the left side.
- `side`: Scattered red spots (similar to `lying`/`its`).
- Repeats for the second `its`, `round`, `side`.
---
### **Analysis**
1. **Categories and Subcategories**
- **Primary Categories**:
`cylinder`, `lying`, `on`, `its`, `flat`, `side`, `round`
- **Subcategories**:
- Positional distribution (left, center, right, scattered).
- Repetition of labels (e.g., `cylinder` appears twice in the top row).
2. **Trends**
- **`cylinder`**: Consistent red spot on the left, suggesting localized high intensity.
- **`lying`/`its`**: Scattered red spots, indicating dispersed high-intensity regions.
- **`on`**: Red spot on the right, mirroring `cylinder` but inverted spatially.
- **`flat`**: Single red spot on the left, similar to `cylinder`.
- **`round`**: Scattered red spots, akin to `lying`/`its`.
3. **Missing Elements**
- **Legend**: Absent. Color interpretation assumes red = high intensity, blue = low intensity (standard heatmap convention).
- **Axis Titles**: No axes present; heatmaps are standalone visualizations.
- **Data Table**: No numerical data or structured table provided.
---
### **Spatial Grounding**
- **Legend Placement**: Not applicable (no legend exists).
- **Color Consistency**:
- Red spots consistently indicate high-intensity regions across all heatmaps.
- Blue dominates the background, suggesting baseline/low values.
---
### **Conclusion**
The heatmaps visualize categorical data distributions with positional intensity variations. Labels like `cylinder`, `lying`, and `on` suggest geometric or positional themes, while `its`, `flat`, and `round` may relate to object properties or states. The absence of a legend limits quantitative interpretation, but spatial patterns (e.g., left/right red spots, scattered distributions) are clearly discernible.