TECHNICAL ASSET FINGERPRINT
e55b868a8388ceb45184313d
Click to view fullscreen
Press ESC or click to close
FOUND IN PAPERS
EXPERT: healer-alpha-free VERSION 1
RUNTIME: free/openrouter/healer-alpha
INTEL_VERIFIED
## Technical Diagram: Speculative Decoding with Recursive Rejection Sampling
### Overview
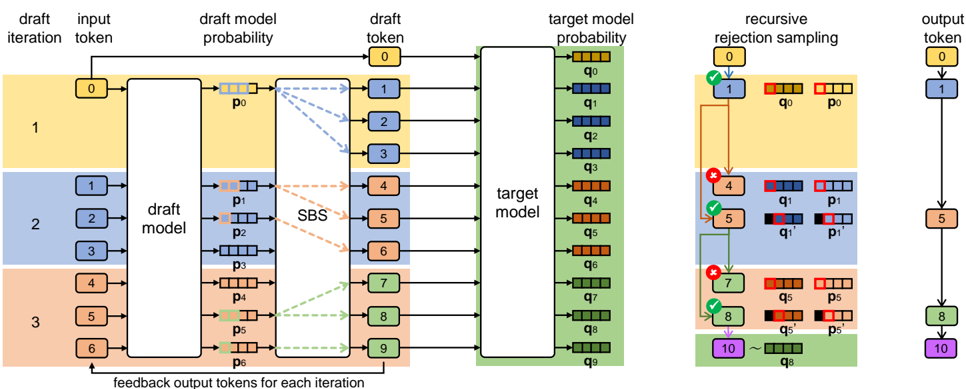
This image is a technical flowchart illustrating a machine learning inference process, specifically a **speculative decoding** or **draft-and-verify** framework for language models. The diagram details a multi-iteration process where a smaller "draft model" proposes candidate tokens, which are then verified in parallel by a larger "target model" using a rejection sampling mechanism. The process aims to accelerate text generation.
### Components/Axes
The diagram is organized into three main vertical sections, flowing from left to right.
**1. Left Section: Draft Iteration & Input**
* **Column Headers (Top):** `draft iteration`, `input token`, `draft model probability`, `draft token`, `target model probability`.
* **Rows (Iterations):** Three horizontal bands, color-coded:
* **Top Band (Yellow):** Labeled `1` in the "draft iteration" column.
* **Middle Band (Blue):** Labeled `2`.
* **Bottom Band (Orange):** Labeled `3`.
* **Input Tokens:** Sequences of numbered tokens (0, 1, 2, 3, 4, 5, 6) in rounded rectangles, fed into the "draft model".
* **Draft Model:** A large white rectangle labeled `draft model`. It processes input tokens and outputs probability distributions.
* **Draft Model Probabilities:** Represented by small horizontal bar charts labeled `p0`, `p1`, `p2`, `p3`, `p4`, `p5`, `p6`. Each bar has multiple colored segments (blue, orange, green, etc.).
* **SBS Block:** A vertical rectangle labeled `SBS` (likely "Speculative Beam Search" or similar). Dashed arrows connect draft model probabilities to this block.
* **Draft Tokens:** Numbered tokens (0-9) in colored rectangles (yellow, blue, orange, green) output from the SBS block.
* **Feedback Loop:** An arrow at the bottom labeled `feedback output tokens for each iteration` points from the final output tokens back to the input of the draft model for the next iteration.
**2. Center Section: Target Model Verification**
* **Target Model:** A large white rectangle labeled `target model`. It receives all draft tokens from the SBS block in parallel.
* **Target Model Probabilities:** A vertical stack of horizontal bar charts labeled `q0` through `q9`. Each bar corresponds to a draft token and shows a probability distribution. The colors in these bars (red, blue, green) are compared against the draft model's probabilities (`p` values).
**3. Right Section: Recursive Rejection Sampling & Output**
* **Header:** `recursive rejection sampling`.
* **Sampling Process:** A flowchart showing the verification of each draft token (`q` vs. `p`).
* Tokens are checked sequentially (0, 1, 4, 5, 7, 8, 10).
* Green checkmarks (✓) indicate acceptance.
* Red crosses (✗) indicate rejection.
* Accepted tokens (e.g., 1, 5, 8) are passed to the final output.
* Rejected tokens (e.g., 4, 7) trigger a resampling step, shown with updated probability bars (`q1'`, `p1'`, `q5'`, `p5'`).
* **Final Output Column:** Labeled `output token`. A vertical sequence of accepted tokens: `0`, `1`, `5`, `8`, `10`. These are connected by arrows, showing the final generated sequence.
### Detailed Analysis
**Process Flow:**
1. **Iteration 1 (Yellow):** Takes input token `0`. The draft model generates probabilities `p0`. The SBS block proposes draft tokens `1`, `2`, `3`.
2. **Iteration 2 (Blue):** Takes input tokens `1`, `2`, `3`. The draft model generates probabilities `p1`, `p2`, `p3`. The SBS block proposes draft tokens `4`, `5`, `6`.
3. **Iteration 3 (Orange):** Takes input tokens `4`, `5`, `6`. The draft model generates probabilities `p4`, `p5`, `p6`. The SBS block proposes draft tokens `7`, `8`, `9`.
4. **Parallel Verification:** All draft tokens (0-9) are fed into the target model, which computes their probabilities (`q0`-`q9`).
5. **Recursive Rejection Sampling (Right Panel):** The system evaluates tokens in order:
* Token `0` (from initial input) is accepted (✓).
* Token `1` (from Iteration 1) is accepted (✓) after comparing `q0` and `p0`.
* Token `4` (from Iteration 2) is rejected (✗) because `q1` and `p1` mismatch. A new token `5` is sampled from the adjusted distribution `q1'` and accepted.
* Token `7` (from Iteration 3) is rejected (✗). Token `8` is sampled from `q5'` and accepted.
* The process continues until token `10` is generated.
6. **Output:** The final accepted sequence is `0 → 1 → 5 → 8 → 10`.
**Color Coding & Legend:**
* **Yellow:** Associated with Draft Iteration 1 and its tokens (0, 1, 2, 3).
* **Blue:** Associated with Draft Iteration 2 and its tokens (1, 2, 3, 4, 5, 6).
* **Orange:** Associated with Draft Iteration 3 and its tokens (4, 5, 6, 7, 8, 9).
* **Green:** Used for the Target Model block and some final output tokens (8, 10), possibly indicating verified or final outputs.
* **Probability Bars:** Use a consistent multi-color scheme (red, blue, green, orange segments) to represent different token probabilities in both draft (`p`) and target (`q`) models.
### Key Observations
1. **Parallelism:** The core efficiency gain is shown by the target model processing all draft tokens (0-9) in a single parallel step, rather than sequentially.
2. **Rejection & Resampling:** The diagram explicitly shows that rejected tokens (4, 7) are not simply discarded. They trigger a resampling step using the target model's distribution (`q1'`, `q5'`), which is a key detail of the algorithm.
3. **Token Overlap:** Tokens from one iteration (e.g., token `1` from Iteration 1) become input for the next iteration (Iteration 2), creating a sliding window or chain.
4. **Spatial Layout:** The legend (color bands for iterations) is integrated into the main flow on the left. The rejection sampling logic is isolated on the right for clarity. The target model acts as a central verification hub.
### Interpretation
This diagram visually explains the **speculative decoding** technique used to speed up large language model inference. The key insight is using a fast, smaller draft model to propose multiple candidate continuations (tokens) which are then verified in a single batch by the accurate but slower target model.
* **What it demonstrates:** The process balances speed and accuracy. The draft model generates guesses in parallel, and the target model acts as a "quality gate," accepting correct guesses and correcting wrong ones via rejection sampling. This reduces the number of expensive forward passes needed from the target model.
* **Relationships:** The `SBS` block is crucial for generating diverse, high-probability draft candidates from the draft model's output. The rejection sampling block is the decision engine, comparing `p` (draft probability) and `q` (target probability) to decide whether to accept a token or resample.
* **Notable Anomaly/Pattern:** The final output sequence (`0,1,5,8,10`) is not a simple concatenation of the draft tokens. It includes resampled tokens (`5`, `8`) and skips rejected ones (`4`, `7`), demonstrating the non-deterministic, corrective nature of the sampling process. The feedback loop indicates this is an iterative, autoregressive process where outputs become future inputs.
DECODING INTELLIGENCE...