## 3D Scatter Plot with Slices
### Overview
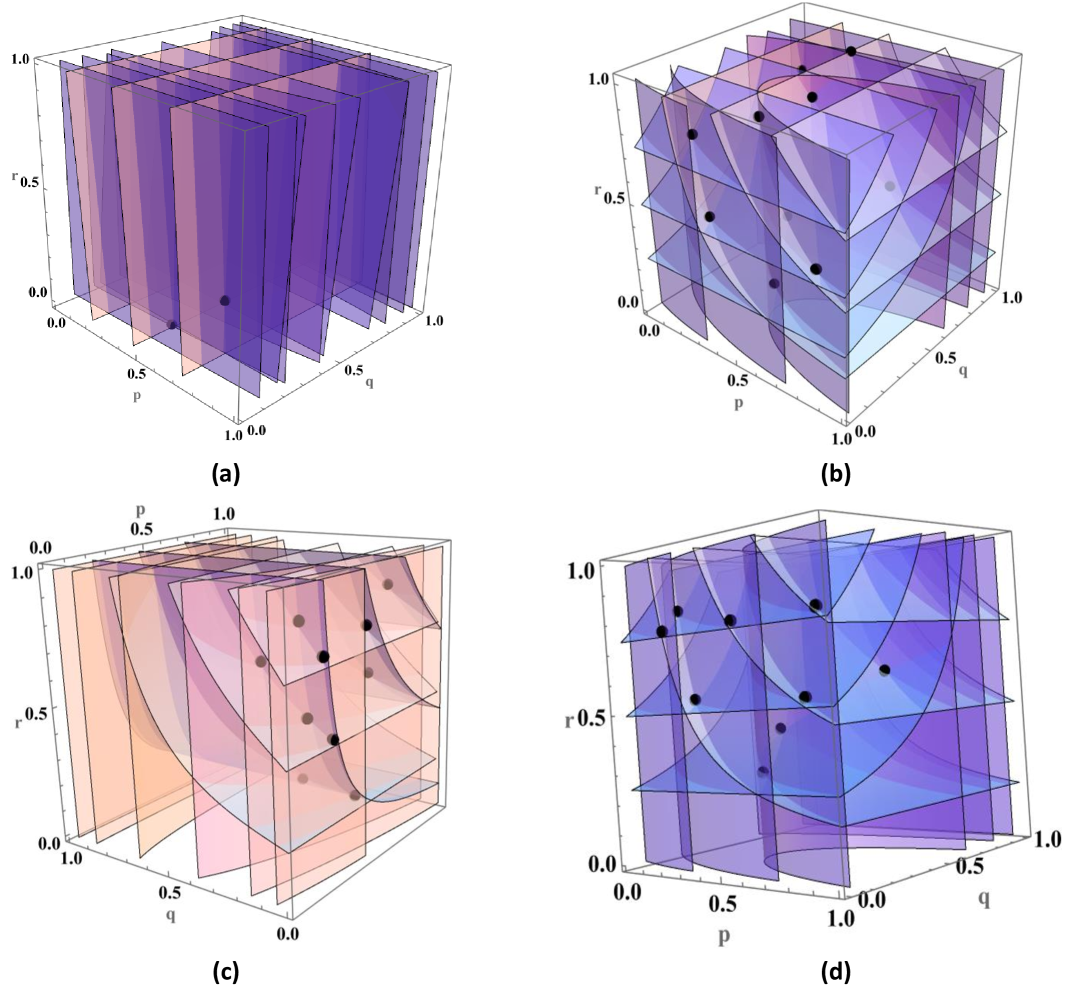
The image contains four 3D scatter plots, labeled (a), (b), (c), and (d). Each plot visualizes data points within a cube defined by the axes p, q, and r, all ranging from 0.0 to 1.0. The plots also include semi-transparent slices along the p, q, and r axes, creating a grid-like structure within the cube. The primary difference between the plots is the number and placement of the data points (black dots) within the cube.
### Components/Axes
* **Axes:** Each plot has three axes:
* p-axis: Horizontal axis, ranging from 0.0 to 1.0.
* q-axis: Axis extending into the depth of the image, ranging from 0.0 to 1.0.
* r-axis: Vertical axis, ranging from 0.0 to 1.0.
* **Slices:** Semi-transparent planes are placed parallel to the coordinate planes (pq, pr, qr) at intervals along each axis. These slices create a visual grid within the cube.
* **Data Points:** Black dots represent data points within the 3D space. The number and location of these points vary between the four plots.
* **Labels:** Each plot is labeled with a lowercase letter in parentheses: (a), (b), (c), and (d).
### Detailed Analysis
**Plot (a):**
* Contains only one data point.
* The single data point is located at approximately p=0.2, q=0.2, r=0.1.
**Plot (b):**
* Contains 8 data points.
* Data point locations (approximate):
* p=0.2, q=0.2, r=0.8
* p=0.2, q=0.8, r=0.8
* p=0.8, q=0.2, r=0.8
* p=0.8, q=0.8, r=0.8
* p=0.2, q=0.2, r=0.2
* p=0.2, q=0.8, r=0.2
* p=0.8, q=0.2, r=0.2
* p=0.8, q=0.8, r=0.2
**Plot (c):**
* Contains 8 data points.
* Data point locations (approximate):
* p=0.2, q=0.2, r=0.8
* p=0.2, q=0.8, r=0.8
* p=0.8, q=0.2, r=0.8
* p=0.8, q=0.8, r=0.8
* p=0.2, q=0.2, r=0.2
* p=0.2, q=0.8, r=0.2
* p=0.8, q=0.2, r=0.2
* p=0.8, q=0.8, r=0.2
**Plot (d):**
* Contains 8 data points.
* Data point locations (approximate):
* p=0.2, q=0.2, r=0.8
* p=0.2, q=0.8, r=0.8
* p=0.8, q=0.2, r=0.8
* p=0.8, q=0.8, r=0.8
* p=0.2, q=0.2, r=0.2
* p=0.2, q=0.8, r=0.2
* p=0.8, q=0.2, r=0.2
* p=0.8, q=0.8, r=0.2
### Key Observations
* Plots (b), (c), and (d) have the same data point configuration.
* Plot (a) has only one data point, located near the origin.
* The slices help visualize the location of the data points within the 3D space.
### Interpretation
The plots likely represent different configurations or states of a system defined by the parameters p, q, and r. Plots (b), (c), and (d) represent the same state, while plot (a) represents a different state with a single data point concentrated near the origin. The slices provide a visual aid for understanding the distribution of data points within the 3D parameter space. The data suggests that the system can exist in multiple states, with some states being more complex (having more data points) than others. The specific meaning of p, q, and r would depend on the context of the data.