\n
## 3D Charts: Visualization of Functions in a Unit Cube
### Overview
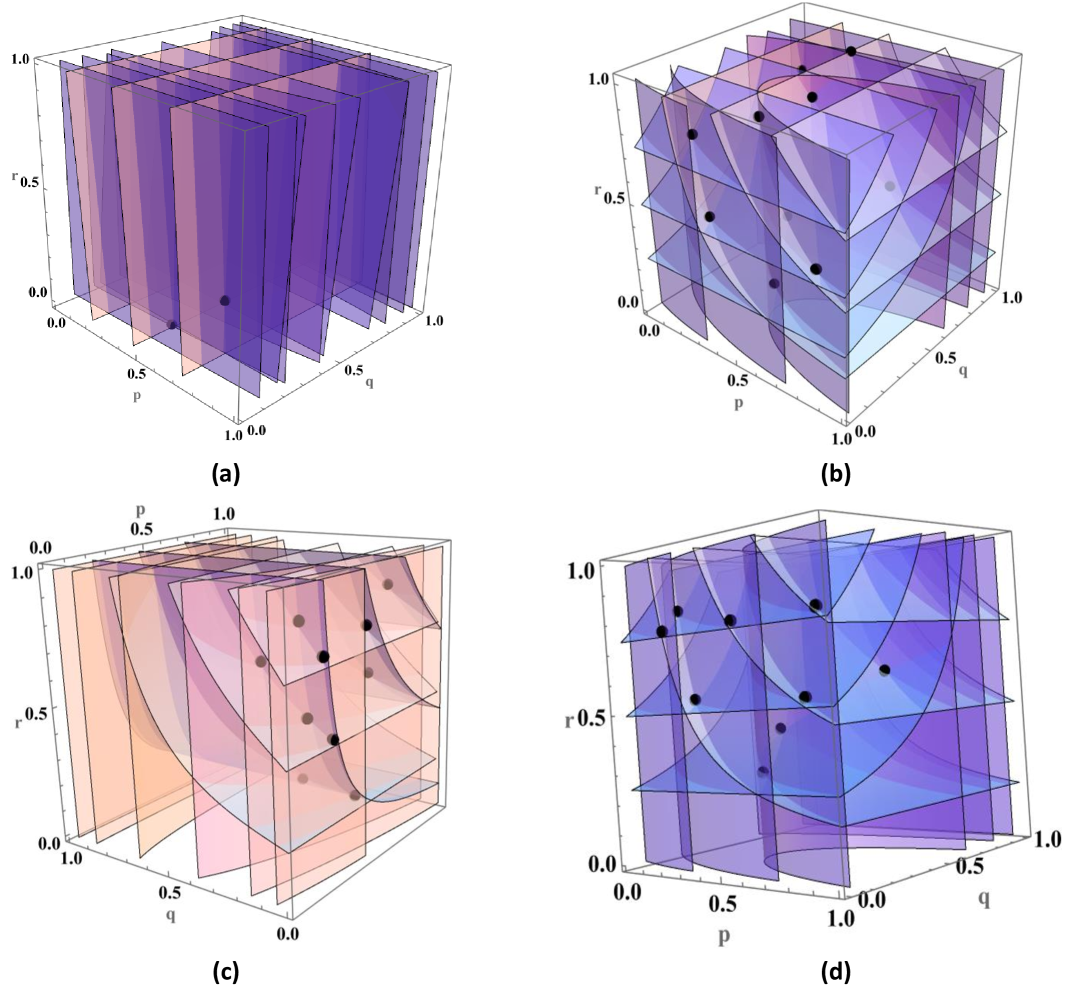
The image presents four 3D charts, each depicting a function of three variables (p, q, r) within a unit cube (0 ≤ p, q, r ≤ 1). Each chart visualizes the function's value as height above the p-q plane. The charts appear to represent different functions or different parameterizations of the same function. Each chart is labeled (a), (b), (c), and (d). Each chart also contains a sparse scattering of black dots.
### Components/Axes
Each chart shares the following components:
* **Axes:** Three axes labeled 'p', 'q', and 'r'. The axes range from 0.0 to 1.0.
* **Coordinate System:** A 3D Cartesian coordinate system.
* **Visual Representation:** A surface plot representing the function's value.
* **Dots:** Black dots scattered across the surface. Their significance is unclear without additional context.
* **Labels:** Each chart is labeled with a letter: (a), (b), (c), and (d) positioned in the bottom-left corner.
### Detailed Analysis or Content Details
**Chart (a):**
* **Color:** Predominantly purple shades.
* **Trend:** The surface generally slopes downward from left to right and from front to back. The highest values appear to be around p=0, q=0.
* **Approximate Data Points (visually estimated):** It's difficult to extract precise numerical values from the visualization. However, we can observe:
* At p=0, q=0, r is approximately 1.0.
* At p=1, q=1, r is approximately 0.0.
* The surface appears to be relatively smooth.
**Chart (b):**
* **Color:** Shades of blue and purple.
* **Trend:** The surface is more complex than (a), with multiple peaks and valleys. The black dots seem to be concentrated on the peaks.
* **Approximate Data Points (visually estimated):**
* Several peaks around p=0.5, q=0.5, with r varying.
* A valley around p=0, q=0, r=0.
* The surface is less smooth than (a).
**Chart (c):**
* **Color:** Shades of orange and red.
* **Trend:** The surface slopes downward from left to right and from front to back, similar to (a), but with a different overall shape. The black dots are again concentrated on peaks.
* **Approximate Data Points (visually estimated):**
* At p=0, q=0, r is approximately 1.0.
* At p=1, q=1, r is approximately 0.0.
* The surface appears to be relatively smooth.
**Chart (d):**
* **Color:** Shades of purple and blue.
* **Trend:** The surface is complex, with a mix of peaks and valleys. The black dots are scattered across the surface.
* **Approximate Data Points (visually estimated):**
* Peaks around p=0.5, q=0.5, with r varying.
* Valleys around p=0, q=0, r=0 and p=1, q=1, r=1.
* The surface is less smooth than (a) and (c).
### Key Observations
* The charts represent different functions or different parameterizations of a similar function.
* The black dots appear to be located at local maxima or critical points of the functions.
* Charts (a) and (c) have similar overall trends, while (b) and (d) are more complex.
* The color schemes are different for each chart, potentially indicating different value ranges or function characteristics.
### Interpretation
The image likely demonstrates the visualization of different mathematical functions defined over a three-dimensional space. The functions are likely continuous, as represented by the smooth surfaces. The black dots suggest the identification of critical points (maxima, minima, or saddle points) of these functions. The different color schemes and surface shapes indicate that each chart represents a unique function or a different configuration of the same function.
Without further context, it's difficult to determine the specific mathematical functions being visualized or the purpose of the black dots. However, the image suggests an exploration of multi-variable functions and their properties, potentially in the context of optimization, surface analysis, or data visualization. The use of a unit cube suggests that the functions are being studied within a constrained domain. The charts could be used to compare and contrast the behavior of different functions or to analyze the sensitivity of a function to changes in its parameters.