## Line Charts: Performance Comparison on GSM8K and MATH Datasets
### Overview
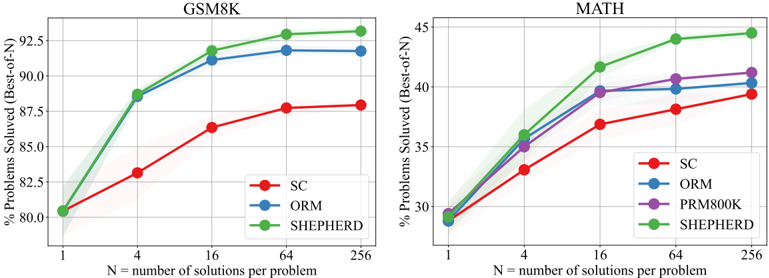
The image presents two line charts comparing the performance of different models (SC, ORM, PRM800K, and SHEPHERD) on the GSM8K and MATH datasets. The charts show the percentage of problems solved (Best-of-N) as a function of N, the number of solutions per problem.
### Components/Axes
**Left Chart (GSM8K):**
* **Title:** GSM8K
* **X-axis:** N = number of solutions per problem. Scale: 1, 4, 16, 64, 256 (logarithmic scale)
* **Y-axis:** % Problems Solved (Best-of-N). Scale: 80.0% to 92.5%
* **Legend:** Located in the bottom-right of the chart.
* SC (Red)
* ORM (Blue)
* SHEPHERD (Green)
**Right Chart (MATH):**
* **Title:** MATH
* **X-axis:** N = number of solutions per problem. Scale: 1, 4, 16, 64, 256 (logarithmic scale)
* **Y-axis:** % Problems Solved (Best-of-N). Scale: 30% to 45%
* **Legend:** Located in the bottom-right of the chart.
* SC (Red)
* ORM (Blue)
* PRM800K (Purple)
* SHEPHERD (Green)
### Detailed Analysis
**GSM8K Chart:**
* **SC (Red):** Starts at approximately 80.5% at N=1, increases to about 83% at N=4, then to 86.2% at N=16, 87.5% at N=64, and finally to 88% at N=256. The rate of increase diminishes as N increases.
* **ORM (Blue):** Starts at approximately 80.5% at N=1, increases to about 88% at N=4, then to 91.5% at N=16, 91.8% at N=64, and finally to 91.8% at N=256. The rate of increase diminishes as N increases.
* **SHEPHERD (Green):** Starts at approximately 80.5% at N=1, increases to about 88.5% at N=4, then to 92% at N=16, 92.5% at N=64, and finally to 92% at N=256. The rate of increase diminishes as N increases.
**MATH Chart:**
* **SC (Red):** Starts at approximately 29% at N=1, increases to about 33% at N=4, then to 37% at N=16, 37.5% at N=64, and finally to 38% at N=256. The rate of increase diminishes as N increases.
* **ORM (Blue):** Starts at approximately 29% at N=1, increases to about 35% at N=4, then to 38% at N=16, 39% at N=64, and finally to 39.5% at N=256. The rate of increase diminishes as N increases.
* **PRM800K (Purple):** Starts at approximately 29% at N=1, increases to about 36% at N=4, then to 38% at N=16, 39% at N=64, and finally to 40% at N=256. The rate of increase diminishes as N increases.
* **SHEPHERD (Green):** Starts at approximately 29% at N=1, increases to about 36% at N=4, then to 41% at N=16, 42% at N=64, and finally to 42.5% at N=256. The rate of increase diminishes as N increases.
### Key Observations
* For both datasets, performance generally increases with the number of solutions per problem (N).
* The rate of performance increase diminishes as N increases, suggesting diminishing returns.
* SHEPHERD consistently outperforms SC on both datasets.
* On GSM8K, SHEPHERD and ORM perform similarly and better than SC.
* On MATH, SHEPHERD outperforms ORM, PRM800K, and SC. PRM800K outperforms ORM and SC.
### Interpretation
The charts illustrate the impact of increasing the number of solutions per problem (N) on the performance of different models in solving mathematical problems. The results suggest that increasing N generally improves performance, but the gains diminish as N becomes larger. The relative performance of the models varies depending on the dataset. SHEPHERD appears to be the most effective model overall, particularly on the MATH dataset. The performance differences between the models highlight the importance of model selection and optimization for specific problem domains.