## Line Graphs: Performance of Problem-Solving Methods Across N Solutions
### Overview
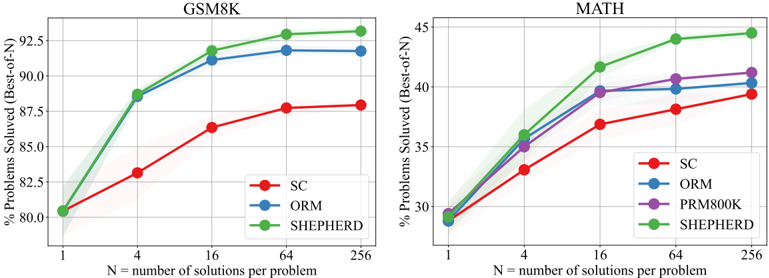
The image contains two line graphs comparing the performance of different problem-solving methods (SC, ORM, PRM800K, SHEPHERD) on two datasets: **GSM8K** (left) and **MATH** (right). The x-axis represents the number of solutions per problem (N = 1, 4, 16, 64, 256), and the y-axis shows the percentage of problems solved. Each method is represented by a distinct colored line, with shaded regions indicating confidence intervals.
---
### Components/Axes
#### **GSM8K Graph (Left)**
- **X-axis**: N = number of solutions per problem (1, 4, 16, 64, 256)
- **Y-axis**: % Problems Solved (Best-of-N) (80% to 92.5%)
- **Legend**:
- **SC** (red)
- **ORM** (blue)
- **SHEPHERD** (green)
- **Shading**: Confidence intervals around each line.
#### **MATH Graph (Right)**
- **X-axis**: N = number of solutions per problem (1, 4, 16, 64, 256)
- **Y-axis**: % Problems Solved (Best-of-N) (30% to 45%)
- **Legend**:
- **SC** (red)
- **ORM** (blue)
- **PRM800K** (purple)
- **SHEPHERD** (green)
- **Shading**: Confidence intervals around each line.
---
### Detailed Analysis
#### **GSM8K Graph**
- **SC (Red)**:
- Starts at **80%** (N=1), increases to **82.5%** (N=4), **85%** (N=16), **87.5%** (N=64), and plateaus at **87.5%** (N=256).
- **Trend**: Gradual, linear improvement with diminishing returns.
- **ORM (Blue)**:
- Starts at **80%** (N=1), rises to **87.5%** (N=4), **91%** (N=16), **92%** (N=64), and stabilizes at **92%** (N=256).
- **Trend**: Steeper initial growth, then plateaus.
- **SHEPHERD (Green)**:
- Starts at **80%** (N=1), jumps to **87.5%** (N=4), **92%** (N=16), **93%** (N=64), and **93.5%** (N=256).
- **Trend**: Rapid early improvement, sustained high performance.
#### **MATH Graph**
- **SC (Red)**:
- Starts at **30%** (N=1), increases to **32%** (N=4), **35%** (N=16), **37.5%** (N=64), and **39%** (N=256).
- **Trend**: Slow, linear growth with minimal gains at higher N.
- **ORM (Blue)**:
- Starts at **30%** (N=1), rises to **35%** (N=4), **39%** (N=16), **40%** (N=64), and **40%** (N=256).
- **Trend**: Moderate improvement, plateaus after N=16.
- **PRM800K (Purple)**:
- Starts at **30%** (N=1), increases to **35%** (N=4), **39%** (N=16), **40.5%** (N=64), and **41%** (N=256).
- **Trend**: Similar to ORM but slightly higher at N=64 and N=256.
- **SHEPHERD (Green)**:
- Starts at **30%** (N=1), jumps to **35%** (N=4), **40%** (N=16), **43%** (N=64), and **44%** (N=256).
- **Trend**: Strong early gains, sustained outperformance.
---
### Key Observations
1. **SHEPHERD Dominates**: In both datasets, SHEPHERD consistently outperforms other methods, especially at higher N values (e.g., 93.5% vs. 87.5% in GSM8K at N=256).
2. **SC Lags Behind**: SC shows the slowest improvement across all N values, suggesting lower efficiency.
3. **ORM vs. PRM800K**: ORM and PRM800K perform similarly in MATH, but PRM800K edges out ORM at N=64 and N=256.
4. **Dataset Differences**: GSM8K problems have higher baseline performance (80–93.5%) compared to MATH (30–44%), indicating potential differences in problem difficulty or method suitability.
---
### Interpretation
- **Efficiency of SHEPHERD**: Its rapid improvement and high performance at large N suggest it is optimized for scaling, possibly leveraging parallel or hierarchical problem-solving strategies.
- **SC’s Limitations**: The flat trend for SC implies it struggles with complex or large-scale problems, possibly due to a lack of adaptive mechanisms.
- **ORM/PRM800K Trade-offs**: While ORM and PRM800K show moderate gains, their plateaus at higher N suggest diminishing returns, highlighting the need for methods that balance exploration and exploitation.
- **Dataset-Specific Insights**: The stark performance gap between GSM8K and MATH may reflect differences in problem structure (e.g., GSM8K’s arithmetic vs. MATH’s reasoning tasks), emphasizing the importance of method adaptability.
This analysis underscores the critical role of method design in scaling problem-solving capabilities, with SHEPHERD emerging as the most robust approach across both datasets.