## Bar Chart: Distribution of Gallery Sizes (Similarity Threshold = 0.5)
### Overview
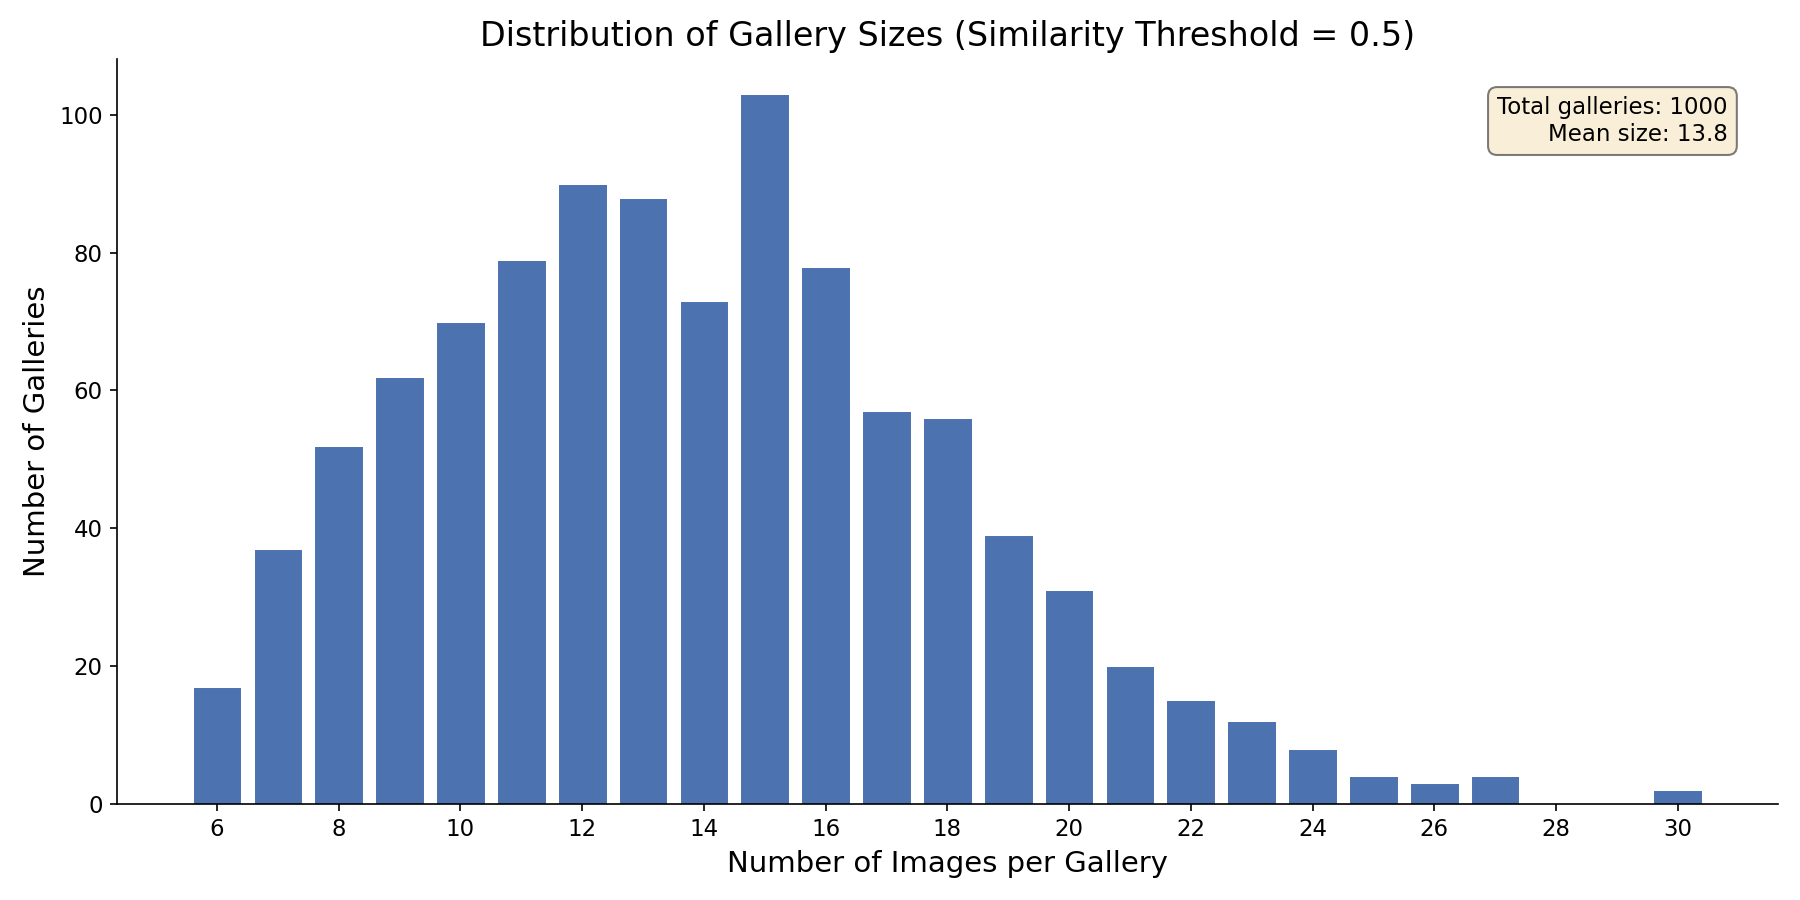
The chart visualizes the distribution of gallery sizes (number of images per gallery) across 1,000 galleries, with a mean size of 13.8 images. Galleries are grouped by image count (x-axis) and frequency (y-axis). The distribution is roughly symmetric but slightly skewed right, with a peak at 15 images per gallery.
### Components/Axes
- **X-axis**: "Number of Images per Gallery" (discrete values: 6, 8, 10, ..., 30).
- **Y-axis**: "Number of Galleries" (continuous scale: 0–100).
- **Legend**: Located in the top-right corner, states:
- Total galleries: 1,000
- Mean size: 13.8
- **Bars**: Blue, with heights proportional to gallery counts.
### Detailed Analysis
- **Key Data Points**:
- **6 images**: 15 galleries
- **8 images**: 50 galleries
- **10 images**: 60 galleries
- **12 images**: 90 galleries
- **14 images**: 70 galleries
- **15 images**: 100 galleries (peak)
- **16 images**: 80 galleries
- **18 images**: 55 galleries
- **20 images**: 30 galleries
- **22 images**: 15 galleries
- **24 images**: 8 galleries
- **26 images**: 3 galleries
- **30 images**: 1 gallery
### Key Observations
1. **Peak at 15 images**: The tallest bar (100 galleries) occurs at 15 images per gallery, slightly above the mean (13.8).
2. **Symmetry with Right Skew**: The distribution is roughly symmetric around 15 but skewed right, as higher image counts (e.g., 20–30) have fewer galleries than lower counts (e.g., 6–10).
3. **Rapid Decline Beyond 15**: Galleries with >15 images drop sharply (e.g., 55 galleries at 18 images vs. 100 at 15).
4. **Outliers**: Only 1 gallery has 30 images, and 3 galleries have 26 images, indicating extreme sparsity at the upper end.
### Interpretation
The data suggests that most galleries cluster around 13–15 images, likely due to the similarity threshold (0.5) grouping images into moderately sized collections. The right skew implies that while most galleries are small-to-medium, a few contain significantly more images. The mean (13.8) being slightly below the peak (15) reflects the influence of smaller galleries pulling the average down. This distribution could inform resource allocation (e.g., storage, curation) for galleries near the mean, while outliers (e.g., 30-image galleries) may require specialized handling.