# Technical Document Extraction: Machine Learning Model Training Flowchart
## Diagram Overview
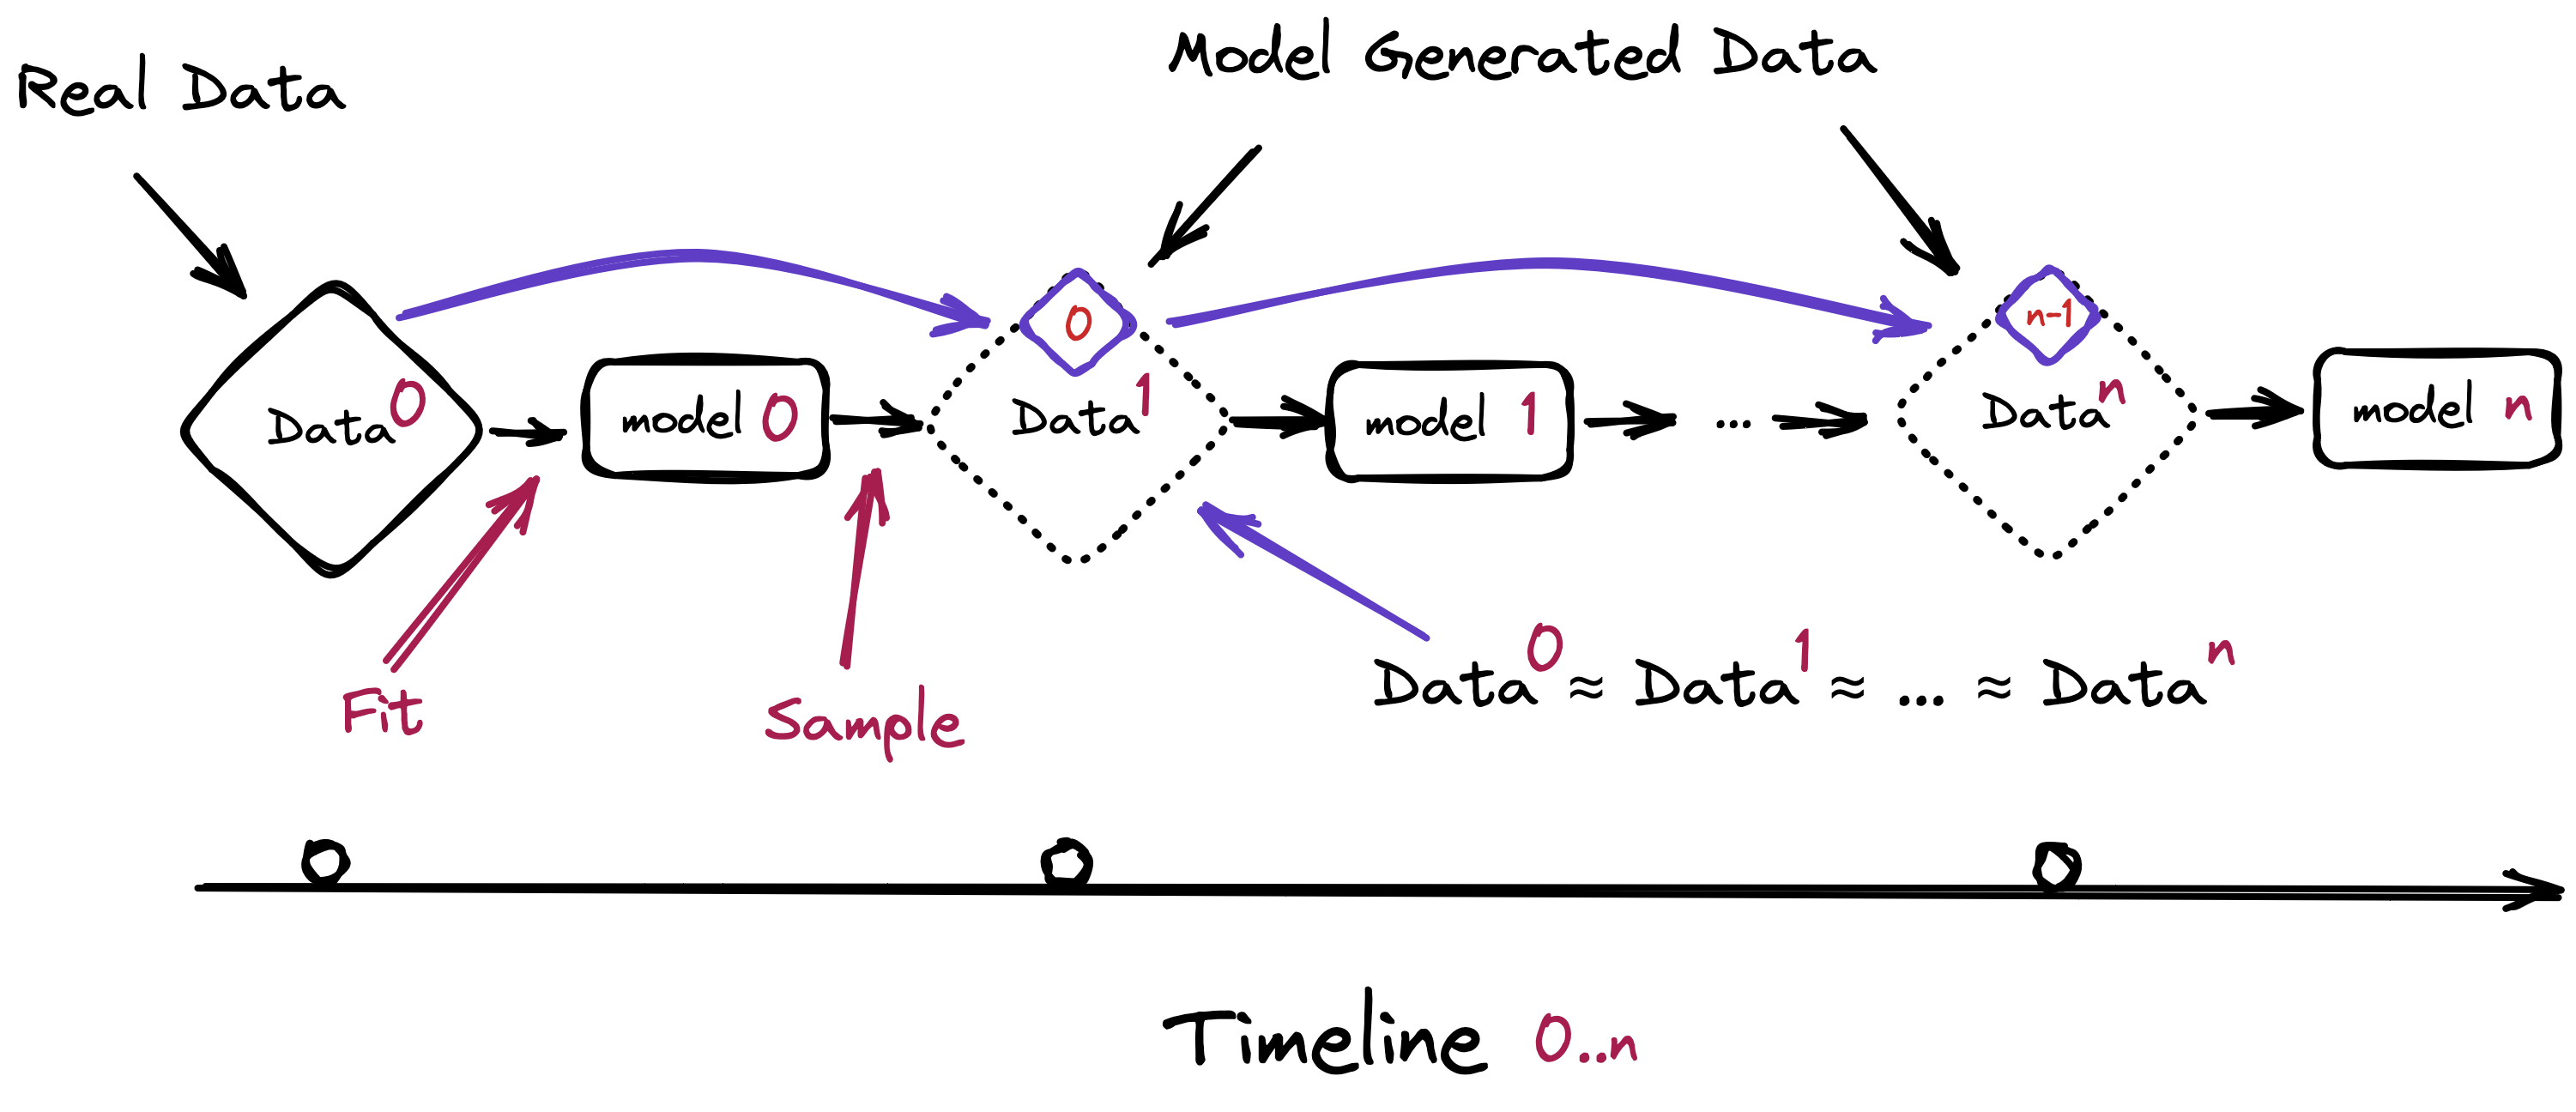
The image depicts a **machine learning model training pipeline** with iterative feedback loops. It combines **real data** and **model-generated data** in a cyclical process over a timeline labeled `0..n`.
---
### Key Components & Flow
1. **Real Data**
- **Label**: "Real Data" (top-left diamond)
- **Flow**:
- Arrows point to `Data⁰` (initial real data input).
- Red arrow labeled **"Fit"** connects `Data⁰` to `model 0`.
2. **Model 0**
- **Label**: "model 0" (black box)
- **Flow**:
- Outputs `Data¹` (model-generated data).
- Purple arrow labeled **"Sample"** feeds `Data¹` back into the pipeline.
3. **Iterative Process**
- **Data¹ → model 1 → Data² → ... → Dataⁿ → model n**
- Each iteration follows the pattern:
- `Dataᵢ` (model-generated data) → `model i` → `Dataᵢ⁺¹` (next iteration's data).
- Arrows labeled **"Sample"** and **"Fit"** repeat cyclically.
4. **Model n**
- **Label**: "model n" (final black box)
- **Flow**:
- Receives `Dataⁿ` (final model-generated data).
---
### Timeline & Axes
- **X-Axis**:
- Labeled **"Timeline 0..n"** (horizontal line at the bottom).
- Markers:
- `0` (start), `1` (intermediate), `n` (end).
- **Y-Axis**:
- No explicit label, but components are vertically stacked above the timeline.
---
### Textual Elements
- **Labels**:
- "Real Data", "Model Generated Data", "Fit", "Sample", "Data⁰", "model 0", "Data¹", "model 1", ..., "Dataⁿ", "model n".
- **Annotations**:
- Red arrows: "Fit" (data → model), "Sample" (model → data).
- Purple arrows: Connect `Dataᵢ` to `model i` and vice versa.
---
### Diagram Structure
1. **Header**:
- Titles: "Real Data" (left) and "Model Generated Data" (right).
2. **Main Chart**:
- Flowchart with alternating diamonds (data) and boxes (models).
- Feedback loops via purple arrows.
3. **Footer**:
- Timeline axis with markers `0`, `1`, `n`.
---
### Notes
- **No legend** is present in the diagram.
- **No numerical data** or chart (e.g., heatmap) is included.
- **No other languages** detected; all text is in English.
---
### Spatial Grounding
- **Legend**: Not applicable (no legend exists).
- **Color Consistency**:
- Black boxes: Models (`model 0`, `model 1`, ..., `model n`).
- Red numbers: Data/model indices (`Data⁰`, `Data¹`, ..., `Dataⁿ`).
- Purple arrows: Feedback connections.
---
### Trend Verification
- **Flow Trend**:
- Iterative cycle: `Data⁰ → model 0 → Data¹ → model 1 → ... → Dataⁿ → model n`.
- No upward/downward slope; cyclical process.
---
### Component Isolation
1. **Header**: Titles and initial data/input.
2. **Main Chart**: Iterative model-training loop.
3. **Footer**: Timeline axis grounding the process.
---
### Conclusion
The diagram illustrates a **reinforcement learning** or **iterative model refinement** process, where real data and model-generated data are continuously sampled, fitted, and updated over time. The absence of numerical values suggests a conceptual rather than quantitative representation.