## Chart/Diagram Type: Combined Plots
### Overview
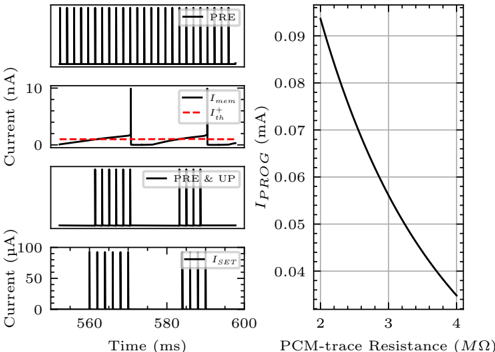
The image presents a combination of plots. On the left, there are four time-series plots showing current variations over time. On the right, there is a plot showing the relationship between the programming current (I_PROG) and the PCM-trace resistance.
### Components/Axes
**Left Side Plots (Time Series):**
* **X-axis (all plots):** Time (ms), ranging from approximately 558 ms to 600 ms.
* **Top Plot:** Shows a series of pulses labeled "PRE". The Y-axis is not explicitly labeled, but it represents some form of signal strength.
* **Second Plot:** Y-axis: Current (nA), ranging from 0 to 10 nA. Two lines are plotted:
* Solid Black Line: Labeled "I_mem"
* Dashed Red Line: Labeled "I+_th"
* **Third Plot:** Shows a series of pulses labeled "PRE & UP". The Y-axis is not explicitly labeled, but it represents some form of signal strength.
* **Bottom Plot:** Y-axis: Current (µA), ranging from 0 to 100 µA. A series of pulses are plotted, labeled "I_SET".
**Right Side Plot:**
* **X-axis:** PCM-trace Resistance (MΩ), ranging from 2 MΩ to 4 MΩ.
* **Y-axis:** I_PROG (mA), ranging from 0.04 mA to 0.09 mA.
* A single black line shows the relationship between PCM-trace resistance and I_PROG.
### Detailed Analysis or ### Content Details
**Left Side Plots (Time Series):**
* **PRE Plot:** Shows a series of pulses with a consistent amplitude. The pulses are closely spaced.
* **I_mem and I+_th Plot:**
* I_mem (Black): Starts near 0 nA, increases linearly to approximately 1 nA around 570 ms, then drops to 0 nA. It increases again to approximately 2 nA around 585 ms, then drops to 0 nA.
* I+_th (Red): A dashed line that remains constant at approximately 1 nA.
* **PRE & UP Plot:** Shows two sets of pulses. The first set occurs around 562 ms, and the second set occurs around 582 ms.
* **I_SET Plot:** Shows two sets of pulses. The first set occurs around 562 ms, and the second set occurs around 582 ms. The pulses reach a peak of approximately 100 µA.
**Right Side Plot:**
* The black line shows a decreasing relationship between PCM-trace resistance and I_PROG.
* At 2 MΩ, I_PROG is approximately 0.093 mA.
* At 3 MΩ, I_PROG is approximately 0.055 mA.
* At 4 MΩ, I_PROG is approximately 0.035 mA.
### Key Observations
* The "PRE" signal consists of a train of pulses.
* The "I_mem" signal increases linearly and then drops to zero, possibly indicating a charging and discharging process.
* The "PRE & UP" and "I_SET" signals are synchronized, suggesting they are related.
* The "I_PROG" decreases as the PCM-trace resistance increases, indicating an inverse relationship.
### Interpretation
The plots likely represent the behavior of a phase-change memory (PCM) cell during a programming operation. The "PRE" signal might be a pre-conditioning pulse. "I_mem" could be the current through the memory cell, and "I+_th" might be a threshold current. "PRE & UP" could represent a combination of pre-conditioning and programming pulses, and "I_SET" could be the current used to set the memory cell to a specific state. The right-side plot shows that the programming current required decreases as the resistance of the PCM-trace increases. This could be due to the fact that higher resistance limits the current flow.