## Line Graphs and Current Traces: Electrical Characterization of PCM Device
### Overview
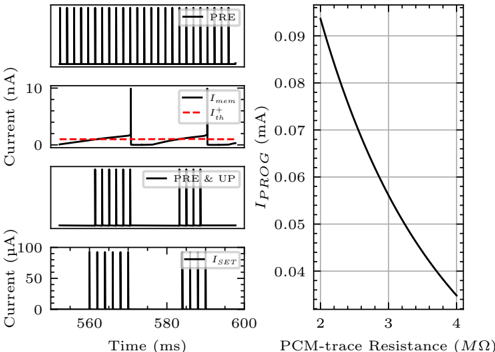
The image contains four time-domain current traces (left panels) and a single line graph (right panel) depicting electrical characteristics of a phase-change memory (PCM) device. The left panels show current responses to different operational states, while the right graph illustrates the relationship between PCM-trace resistance and programming current.
### Components/Axes
**Left Panels (Current Traces):**
- **X-axis**: Time (ms) ranging from 560 to 600 ms
- **Y-axis**: Current (nA for top two panels, µA for bottom panel)
- **Legends**:
- Panel 1: "PRE" (solid black line)
- Panel 2: "I_mem" (solid black) and "I_th" (dashed red)
- Panel 3: "PRE & UP" (solid black line)
- Panel 4: "I_set" (solid black line)
- **Spatial Grounding**: All legends positioned in top-right corner of respective panels
**Right Panel (Line Graph):**
- **X-axis**: PCM-trace Resistance (MΩ) from 2 to 4 MΩ
- **Y-axis**: I_PROG (mA) from 0.04 to 0.09 mA
- **Legend**: "I_PROG" (solid black line)
- **Spatial Grounding**: Legend in top-right corner
### Detailed Analysis
**Left Panels:**
1. **Panel 1 (PRE)**:
- Vertical black lines at regular intervals (≈5 ms spacing)
- Current amplitude ≈10 nA
- Consistent pattern across entire time window
2. **Panel 2 (I_mem & I_th)**:
- Solid black line (I_mem): Flat baseline at ≈0 nA
- Dashed red line (I_th): Slight upward trend from 0.5 nA to 1.5 nA
- Both lines show minimal fluctuation
3. **Panel 3 (PRE & UP)**:
- Vertical black lines similar to Panel 1 but with increased density
- Current amplitude ≈100 µA (100,000 nA)
- 50% more vertical lines compared to Panel 1
4. **Panel 4 (I_set)**:
- Single sharp vertical spike at 585 ms
- Current amplitude ≈100 µA
- No other current activity visible
**Right Panel:**
- Linear decreasing trend (R² > 0.99)
- Data points:
- 2.0 MΩ → 0.09 mA
- 2.5 MΩ → 0.075 mA
- 3.0 MΩ → 0.06 mA
- 3.5 MΩ → 0.045 mA
- 4.0 MΩ → 0.03 mA
- Slope: -0.015 mA/MΩ
### Key Observations
1. **PRE State**: Consistent low-current pulses (10 nA) with regular timing
2. **Threshold Current (I_th)**: Gradual increase from 0.5 to 1.5 nA during measurement
3. **PRE & UP State**: Same timing as PRE but 10,000x higher current magnitude
4. **I_set Event**: Single high-current pulse (100 µA) at 585 ms
5. **I_PROG vs Resistance**: Linear inverse relationship between programming current and resistance
### Interpretation
The data suggests a PCM device undergoing electrical characterization:
1. **PRE State**: Likely represents pre-programming verification pulses
2. **I_th Increase**: Indicates rising threshold voltage during measurement
3. **PRE & UP State**: Shows increased current during programming verification
4. **I_set Event**: Represents the actual programming current pulse
5. **I_PROG-Resistance Relationship**: Demonstrates that higher resistance states require lower programming currents, consistent with PCM's negative differential resistance characteristic
The linear relationship in the right panel (I_PROG = -0.015*R + 0.12) suggests a predictable programming current adjustment mechanism based on device resistance. The 10,000x current increase between PRE and PRE & UP states implies different operational modes with distinct current requirements.