## Diagram: Transient Execution Attack Types
### Overview
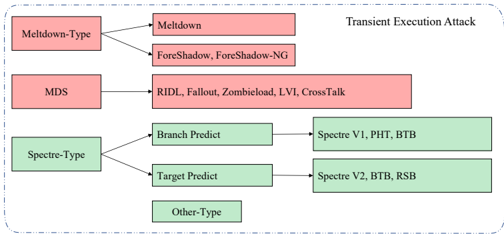
The image is a diagram illustrating the classification of Transient Execution Attacks. It categorizes attacks into Meltdown-Type, MDS, and Spectre-Type, and further sub-categorizes Spectre-Type attacks. The diagram uses rectangular boxes to represent attack types and subtypes, with arrows indicating relationships and classifications.
### Components/Axes
* **Title:** Transient Execution Attack
* **Categories:**
* Meltdown-Type (Red Box)
* MDS (Red Box)
* Spectre-Type (Green Box)
* **Sub-Categories/Specific Attacks:**
* Meltdown (Red Box)
* ForeShadow, ForeShadow-NG (Red Box)
* RIDL, Fallout, Zombieload, LVI, CrossTalk (Red Box)
* Branch Predict (Green Box)
* Target Predict (Green Box)
* Other-Type (Green Box)
* Spectre V1, PHT, BTB (Green Box)
* Spectre V2, BTB, RSB (Green Box)
* **Arrows:** Indicate the relationship between categories and sub-categories.
### Detailed Analysis or Content Details
* **Meltdown-Type:**
* Leads to:
* Meltdown
* ForeShadow, ForeShadow-NG
* **MDS:**
* Leads to:
* RIDL, Fallout, Zombieload, LVI, CrossTalk
* **Spectre-Type:**
* Leads to:
* Branch Predict, which leads to Spectre V1, PHT, BTB
* Target Predict, which leads to Spectre V2, BTB, RSB
* Other-Type
### Key Observations
* The diagram classifies transient execution attacks into three main types: Meltdown-Type, MDS, and Spectre-Type.
* Spectre-Type attacks are further divided based on the prediction mechanism exploited (Branch Predict, Target Predict, and Other-Type).
* The diagram highlights specific attacks that fall under each category.
* Meltdown-Type and MDS are represented with red boxes, while Spectre-Type and its sub-categories are represented with green boxes.
### Interpretation
The diagram provides a hierarchical classification of transient execution attacks, illustrating the relationships between different attack types and their specific manifestations. The categorization helps in understanding the underlying mechanisms and vulnerabilities exploited by these attacks. The use of color (red and green) might indicate different levels of severity or types of vulnerabilities, but this is not explicitly stated in the diagram. The diagram is useful for researchers and security professionals to understand the landscape of transient execution attacks and develop appropriate mitigation strategies.