## Flowchart: Taxonomy of Transient Execution Attacks
### Overview
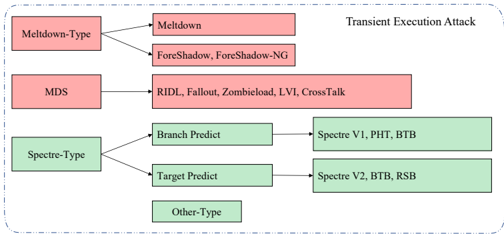
The diagram categorizes transient execution attacks into three primary types: **Meltdown-Type**, **MDS**, and **Spectre-Type**, with hierarchical subcategories. A legend on the right labels the entire structure as a "Transient Execution Attack" taxonomy.
### Components/Axes
- **Legend**:
- Position: Top-right corner.
- Label: "Transient Execution Attack" (black text).
- **Main Categories**:
1. **Meltdown-Type** (red):
- Subcategories:
- Meltdown
- ForeShadow
- ForeShadow-NG
2. **MDS** (red):
- Subcategories:
- RIDL
- Fallout
- Zombieload
- LVI
- CrossTalk
3. **Spectre-Type** (green):
- Subcategories:
- **Branch Predict**:
- Spectre V1
- PHT
- BTB
- **Target Predict**:
- Spectre V2
- BTB
- RSB
4. **Other-Type** (green): No subcategories listed.
### Detailed Analysis
- **Hierarchy**:
- Arrows indicate parent-child relationships (e.g., "Meltdown-Type" → "Meltdown").
- Subcategories are grouped under their parent type (e.g., "Spectre V1" under "Branch Predict").
- **Color Coding**:
- Red: Meltdown-Type and MDS.
- Green: Spectre-Type and Other-Type.
- **Textual Labels**:
- All labels are in English. No non-English text detected.
### Key Observations
1. **Categorization**:
- Meltdown-Type and MDS are grouped under red, while Spectre-Type and Other-Type use green.
- Spectre-Type has the most granular subcategories (e.g., Branch Predict → Spectre V1, PHT, BTB).
2. **Structure**:
- MDS has the most subcategories (5), followed by Spectre-Type (6 subcategories across two branches).
- Other-Type is a standalone category with no further subdivisions.
### Interpretation
- The diagram provides a structured taxonomy of transient execution attacks, grouping them by type and subcategory.
- **Meltdown-Type** and **MDS** represent distinct attack families, while **Spectre-Type** is further divided into prediction-based subcategories (Branch Predict and Target Predict).
- The inclusion of "Other-Type" suggests the taxonomy is not exhaustive, leaving room for unclassified attacks.
- The color coding (red vs. green) may imply severity, prevalence, or technical similarity, though this is not explicitly stated.
- No numerical data or trends are present, as the diagram focuses on categorical relationships rather than quantitative analysis.